
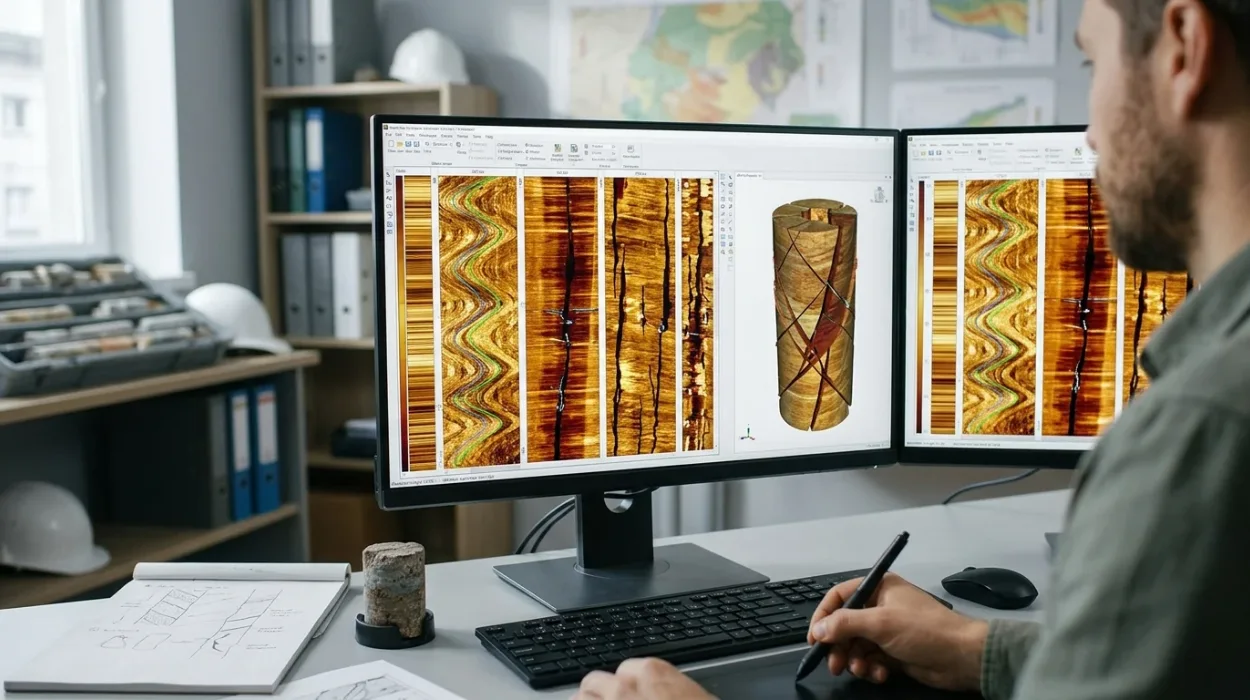
Borehole image logs provide high-resolution azimuthal micro-resistivity and acoustic measurements of the wellbore wall, enabling subsurface teams to distinguish between naturally occurring structural discontinuities and drilling-induced mechanical failures. Accurate classification requires integrating static and dynamic image normalisation, sinusoidal trace fitting, and geomechanical stress modelling. For upstream energy organisations managing complex carbonate reservoirs, misclassifying drilling-induced tensile fractures as conductive natural fractures leads to flawed permeability models, misplaced horizontal well trajectories, and suboptimal completion designs that reduce field recovery rates by 15% to 25%.
Before technical teams compare advanced evaluation workflows, subsurface managers must ensure foundational alignment on why borehole image logs are important for fracture detection within broader reservoir characterisation programmes. While conventional triple-combo wireline logs average rock properties vertically over 0.5 to 1.0 metres, micro-resistivity and ultrasonic imaging tools resolve geological features down to 5 millimetres. This resolution gap separates successful fractured reservoir development from costly well-intervention campaigns, making structured workforce upskilling in borehole image interpretation a primary operational priority for geoscience and reservoir engineering departments.
How Do Subsurface Teams Differentiate Natural Fractures from Drilling-Induced Fractures?
Subsurface teams differentiate natural fractures from drilling-induced fractures by evaluating sinusoidal continuity across the full 360-degree wellbore circumference, analysing aperture conductivity contrasts, and correlating fracture azimuths with the contemporary horizontal stress field. Natural fractures cut across the wellbore as complete sinusoids, whereas induced fractures appear as discontinuous, en-echelon traces restricted to opposing borehole quadrants.
Establishing a clear diagnostic baseline is the first step in natural fracture identification. Natural fractures form over geological timescales due to tectonic folding, faulting, regional uplift, or diagenetic volume reduction. Because these planes transect the rock volume prior to drilling, the cylindrical wellbore intersects them at an oblique angle, projecting a continuous sinusoidal curve onto an unrolled 2D borehole image track. Depending on the mineral infill and drilling fluid properties, natural fractures separate into two distinct operational categories:
Conductive (Open) Natural Fractures: Filled with saline formation brine or conductive water-based drilling mud, these features exhibit low electrical resistivity and appear as dark, continuous sinusoidal traces on micro-resistivity logs. They act as primary fluid flow pathways in tight matrix rocks.
Resistive (Healed/Mineralised) Natural Fractures: Cemented with secondary calcite, quartz, anhydrite, or pyrite, these planes block electrical current and appear as bright, white sinusoidal traces. They frequently act as permeability baffles or compartmentalisation barriers within carbonate reservoirs.
Conversely, induced fractures generate instantaneously during the drilling process when the hoop stress around the borehole wall exceeds the tensile strength of the rock. Drilling-induced tensile fractures (DITFs) propagate parallel to the maximum horizontal stress ($S_{Hmax}$) direction. Because hoop stress concentrates symmetrically on opposite sides of the borehole, DITFs manifest as pairs of vertical or steeply inclined, discontinuous cracks separated by 180 degrees. Unlike natural fractures, DITFs never cross the entire wellbore circumference to form a closed sinusoid, and their depth extent terminates abruptly at lithological boundaries where rock tensile strength increases.
Geometric and Petrophysical Diagnostic Criteria
Geoscientists apply four primary geometric and petrophysical criteria during workstation interpretation to prevent false-positive fracture counts:
Sinusoidal Completeness: A continuous trough-to-peak trace indicates a planar geological feature intersecting the borehole. Discontinuous, hairline vertical streaks restricted to two opposite pad tracks indicate tensile failure induced by excessive equivalent circulating density (ECD).
Apparent Dip and Azimuth Consistency: Natural fracture sets cluster around predictable structural orientations linked to local fault blocks or fold axes. Induced fractures remain strictly aligned with the present-day $S_{Hmax}$ azimuth regardless of local bedding dip variations.
Acoustic Amplitude vs. Resistivity Response: On ultrasonic borehole televiewer logs, open natural fractures produce sharp reductions in reflected acoustic amplitude and measurable increases in two-way travel time due to fluid-filled aperture depth. Healed fractures show high acoustic amplitude comparable to the intact host matrix.
Petal and Petal-Centreline Fractures: These hybrid induced features initiate ahead of the drill bit due to bit weight and fluid pressure, curving downward into the wellbore wall. Interpreters distinguish them from natural fractures by their distinct chevron-like geometry and uniform alignment with the drilling stress tensor.
Diagnostic Attribute | Open Natural Fractures | Healed Natural Fractures | Drilling-Induced Tensile Fractures (DITFs) |
2D Unrolled Geometry | Continuous, complete sinusoid across 360° | Continuous, complete sinusoid across 360° | Discontinuous, vertical/en-echelon pairs separated by 180° |
Micro-Resistivity Signature | Dark (low resistivity) trace | Bright (high resistivity) trace | Dark hairline traces in water-based mud; absent in oil-based mud |
Ultrasonic Acoustic Signature | Low amplitude, increased travel time | High amplitude, normal travel time | Low amplitude along opposing borehole walls |
Orientation Control | Palaeo-stress, structural folding, faulting | Palaeo-stress and diagenetic fluid history | Present-day maximum horizontal stress ($S_{Hmax}$) |
Reservoir Flow Impact | Primary permeability enhancement | Permeability baffle or flow barrier | Zero contribution to far-field reservoir drainage |
Which Borehole Imaging Technologies and Interpretation Methods Deliver Optimal Fracture Evaluation?
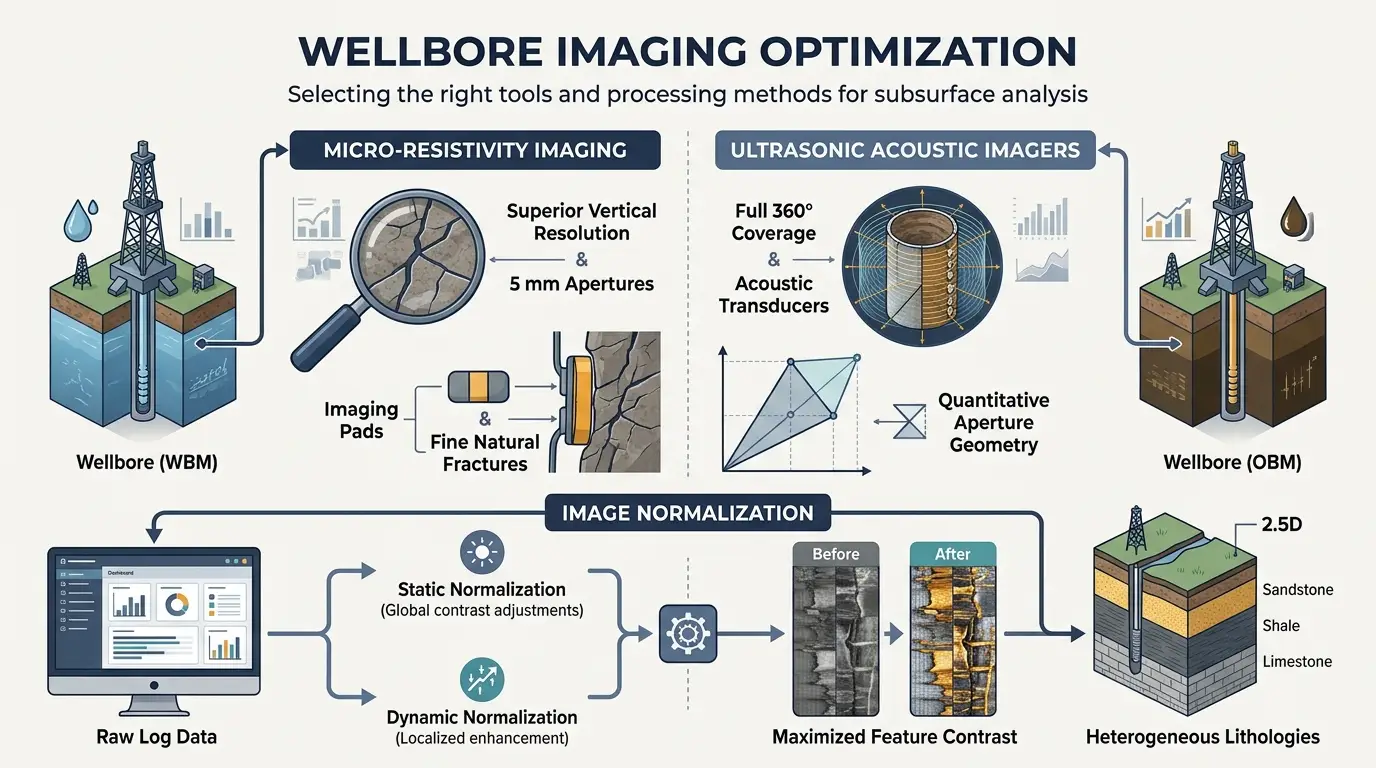
Micro-resistivity imaging tools deliver superior vertical resolution (5 millimetres) in water-based muds for detecting fine natural fracture apertures, whereas ultrasonic acoustic imagers provide full 360-degree wellbore coverage and quantitative aperture geometry in oil-based mud systems. Combining static and dynamic image normalisation methods maximises feature contrast across heterogeneous lithologies.
Selecting the appropriate acquisition hardware and workstation processing workflow directly governs the accuracy of borehole image interpretation. Learning and development (L&D) managers designing technical curricula must ensure geoscientists evaluate the physical limitations of both logging technologies rather than relying on a single standard operating procedure.
Micro-Resistivity Imaging Systems
Micro-resistivity tools deploy articulated pads pressed directly against the borehole wall, emitting high-frequency electrical currents into the formation via dense arrays of button electrodes. In conductive water-based muds (WBM), these tools resolve fractures as narrow as 0.1 millimetres because conductive mud invades the open fracture aperture, creating a massive resistivity contrast against the surrounding rock matrix. However, pad-based tools cover only 40% to 80% of the borehole circumference depending on hole diameter, leaving blank vertical strips between pads where steep, narrow induced fractures can go undetected. When drilling with non-conductive oil-based muds (OBM), specialised oil-base micro-imagers use capacitive coupling to force current through the insulating mudcake, though vertical resolution decreases to approximately 10 to 15 millimetres.
Ultrasonic Acoustic Borehole Televiewers
Ultrasonic imagers operate via a rotating piezoelectric transducer that emits high-frequency acoustic pulses (250 kHz to 1.5 MHz) and records the amplitude and travel time of the reflected wave from the borehole wall. Because acoustic waves travel efficiently through both WBM and OBM without requiring physical pad contact, ultrasonic tools deliver 100% azimuthal coverage. This complete coverage makes ultrasonic logs essential for identifying fracture orientation and breakout widths in geomechanical studies. The primary limitation lies in heavy drilling muds (weights exceeding 14 ppg) or rough, washed-out borehole walls, where acoustic signal attenuation degrades image clarity.
Static vs. Dynamic Normalisation Workflows
Raw borehole image arrays span several orders of magnitude in resistivity or acoustic amplitude, making subtle fractures invisible without mathematical colour-scaling. Interpreters execute two complementary normalisation passes:
Static Normalisation: Applies a single colour scale across the entire logged interval (often 500 to 2,000 metres). Static images preserve true relative contrasts between different rock units, allowing interpreters to separate porous, low-resistivity shale intervals from tight, high-resistivity carbonate reservoirs and identify major fault zones.
Dynamic Normalisation: Recalculates the colour distribution within a sliding vertical window (typically 0.5 to 2.0 metres). Dynamic processing amplifies subtle local contrasts inside homogeneous, tight intervals, bringing faint hairline fractures, vugs, and stylolites into sharp visual focus. Relying solely on dynamic images causes interpreters to overestimate fracture intensity in low-porosity zones, so standard industry workflows mandate side-by-side display of both tracks.
How Are Fracture Orientation, Aperture, and Intensity Quantified for Reservoir Modelling?
Fracture orientation, aperture, and intensity are quantified by fitting mathematical sine waves to borehole image traces to extract true dip and azimuth, applying Luthi-Souhaite resistivity inversion equations to calculate hydraulic width, and computing Terzaghi-corrected P10 linear fracture frequency per metre.
Once visual classification separates natural features from drilling artefacts, subsurface teams convert qualitative image picks into quantitative engineering inputs for discrete fracture network (DFN) models. Errors during this quantification phase distort well productivity forecasts by up to 40%.
Determining True Fracture Orientation
On an unrolled 2D borehole image referenced to True North (vertical wells) or Top-of-Hole (deviated wells), a planar fracture appears as a sine wave. The amplitude of the sine wave corresponds to the apparent dip angle relative to the wellbore axis, while the azimuth of the lowest trough indicates the apparent dip direction. Workstation software applies a 3D coordinate transformation using continuous inclinometer and magnetometer survey data to convert apparent values into true stratigraphic dip and dip azimuth. Analysts plot these vectors on stereonets and rose diagrams to identify dominant fracture sets and evaluate how fracture orientation aligns with the current stress regime, as fractures oriented within 30 degrees of $S_{Hmax}$ remain critically stressed and hydraulically conductive during production.
Calculating Fracture Aperture and Hydrodynamic Width
In water-based mud environments, electrical current flows preferentially into mud-filled open fractures, creating an excess current anomaly measured by the micro-resistivity buttons. Interpreters apply the Luthi-Souhaite algorithm, which integrates the excess current area across the fracture trace and calibrates it against mud resistivity ($R_m$) and flushed-zone formation resistivity ($R_{xo}$):
$$W = c \cdot A \cdot R_m^b \cdot R_{xo}^{1-b}$$
Where $W$ represents fracture aperture in millimetres, $A$ denotes the integrated excess current, and $b$ and $c$ are tool-specific calibration constants. Because drilling fluid invasion and borehole wall chipping artificially widen the mechanical aperture right at the wellbore face, reservoir engineers apply a empirical reduction factor (typically 0.1 to 0.3) to convert image-derived mechanical aperture into effective hydraulic aperture for reservoir simulation.
Correcting Fracture Intensity for Wellbore Trajectory Bias
Counting raw fractures per metre along a wellbore produces biased intensity metrics ($P_{10}$) because vertical wells rarely intersect vertical fractures, whereas horizontal wells drilled perpendicular to a fracture set intersect them at high frequency. Interpreters apply the Terzaghi geometric correction factor to eliminate sampling bias:
$$P_{10,\text{corrected}} = \frac{P_{10,\text{raw}}}{\cos(\alpha)}$$
Where $\alpha$ is the angle between the wellbore trajectory and the normal vector to the fracture plane. When $\alpha$ approaches 90 degrees (a well drilled nearly parallel to a fracture plane), the correction factor becomes unstable, requiring interpreters to apply a maximum weight cutoff (typically capped at $\alpha = 80^\circ$) to prevent artificial inflation of DFN fracture density.
What Technical Challenges Complicate Fracture Evaluation in Carbonate Reservoirs?
Fracture evaluation in carbonate reservoirs is complicated by heterogeneous vuggy porosity, diagenetic stylolites, karst dissolution features, and conductive pyrite nodules that mimic open fracture signatures on micro-resistivity logs. Overcoming these ambiguities requires integrating borehole images with nuclear magnetic resonance and stoneley wave acoustic data.
Unlike siliciclastic sandstones with predictable intergranular pore networks, carbonate reservoirs undergo extensive post-depositional chemical alteration, including dolomitisation, dissolution, and cementation. These diagenetic processes create complex secondary pore geometries that frequently mislead inexperienced image analysts.
Dissolution Vugs and Mouldic Porosity: Isolated or connected cavities dissolved by meteoric or hydrothermal fluids appear as dark, circular-to-irregular blotches on micro-resistivity images. When dissolution enlarges existing hairline fractures, the resulting vuggy fracture exhibits irregular, scalloped edges rather than crisp planar walls, invalidating standard Luthi-Souhaite aperture calculations.
Stylolites and Pressure Solution Seams: Horizontal or bedding-parallel saw-toothed seams formed under overburden pressure concentrate insoluble clay and organic residue. Because clay and organics are electrically conductive, stylolites appear as dark, jagged horizontal traces that novice interpreters frequently misclassify as low-angle open fractures, even though stylolites typically act as vertical permeability barriers.
Conductive Mineral Inclusions: Disseminated pyrite or glauconite clusters create low-resistivity spots that scatter across image tracks. Cross-referencing micro-resistivity logs against high-resolution bulk density and photoelectric factor ($P_e$) curves confirms whether low-resistivity anomalies represent fluid-filled fractures or dense metallic minerals.
To resolve these carbonate-specific ambiguities, integrated evaluation frameworks pair borehole image interpretation with dipole sonic Stoneley wave reflection analysis. Stoneley waves travel along the borehole fluid-rock interface; when they encounter a hydraulically open fracture extending into the reservoir, fluid squeezes into the fracture plane, generating a measurable energy attenuation and reflected chevron pattern that confirms true hydraulic connectivity beyond the wellbore wall.
How Should Corporate L&D and Geoscience Managers Structure Borehole Image Training Programmes?
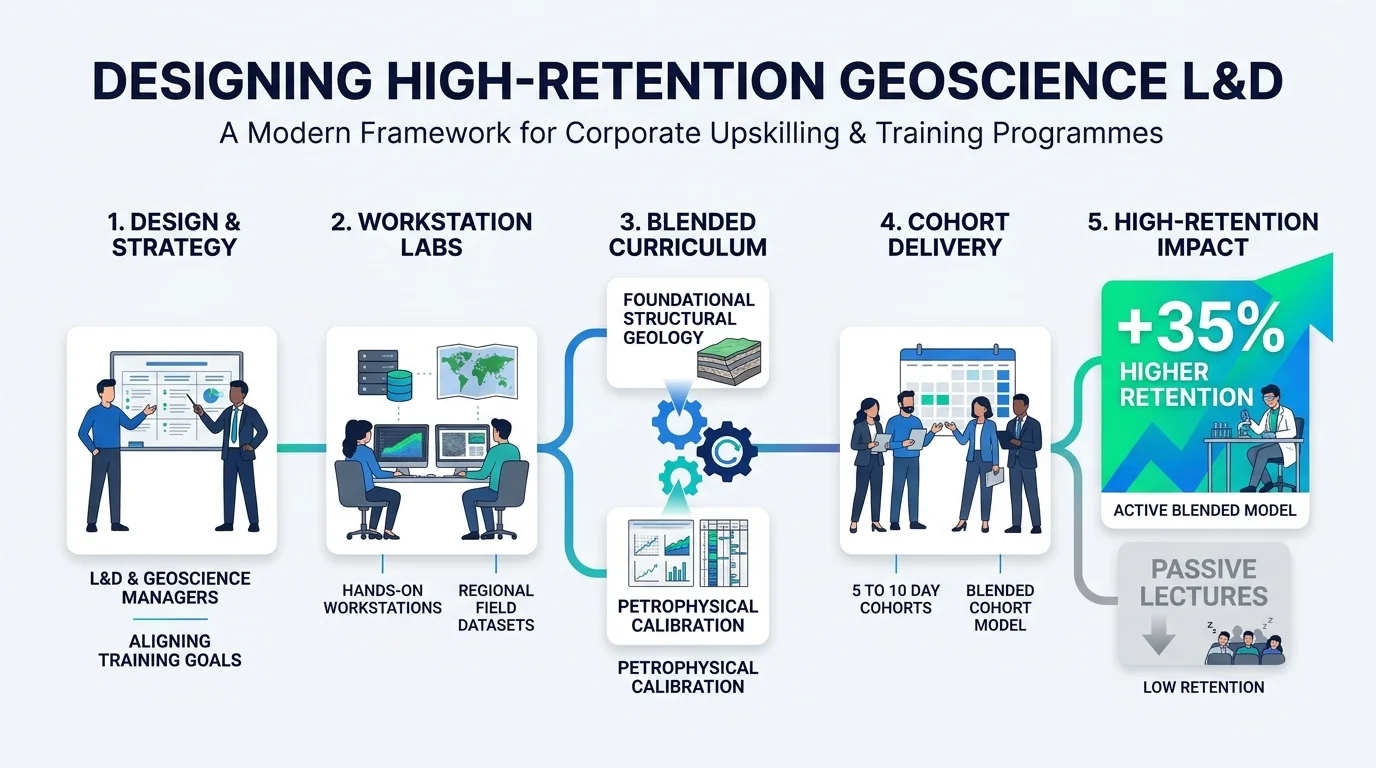
Corporate L&D and geoscience managers should structure training programmes around hands-on workstation interpretation labs using regional field datasets, blending foundational structural geology with quantitative petrophysical calibration. Blended cohort models lasting 5 to 10 days deliver 35% higher skill retention than passive theoretical lectures.
For human resources teams, subsurface team leads, and training managers in upstream energy companies, closing the borehole image interpretation skill gap represents a high-leverage operational investment. Industry workforce assessments indicate that over 60% of early-to-mid-career geologists and petrophysicists rely heavily on automated vendor dip-picking algorithms without auditing the underlying raw pad traces. Automated picking routinely misclassifies drilling-induced petal fractures and sedimentary cross-bedding as natural tectonic fractures, introducing severe errors into multi-million-dollar field development plans.
Evaluating training delivery models requires matching instructional formats to specific workforce roles and operational KPIs:
Training Delivery Model | Ideal Target Audience | Typical Duration | Core Learning Mechanism | Primary Operational KPI Impact |
Intensive Workstation Bootcamp | Operations Geologists, Petrophysicists | 5 Days (40 Hours) | Guided manual picking, static/dynamic QC, real well log exercises | 40% reduction in vendor QC turnaround time |
Blended Modular Cohort | Multidisciplinary Asset Teams (Geologists + Reservoir Engineers) | 4 Weeks (3 hrs/week + capstone) | Virtual live coaching paired with asynchronous DFN modelling labs | 25% improvement in history-matching accuracy for fractured fields |
Executive Technical Workshop | Exploration Managers, Drilling Superintendents | 2 Days (16 Hours) | Case-study evaluation, logging tool selection, geomechanical risk review | 15% reduction in non-productive time (NPT) from wellbore instability |
When selecting an external training provider or designing an internal capability framework, L&D decision-makers must evaluate programmes against four technical readiness criteria:
Software-Agnostic Methodology: Training must teach fundamental physics and geometric diagnostic rules rather than simple button-clicking inside a single commercial software package, ensuring skills transfer across Techlog, Petrel, Recall, and Geolog environments.
Real-World Multi-Basin Datasets: Curricula must include messy, imperfect logs featuring tool stick-and-pull artefacts, pad lift-off, heavy oil-based mud degradation, and complex carbonate reservoirs rather than sanitised textbook examples.
Cross-Disciplinary Integration: Effective programmes bridge the silo between geology and geomechanics, training interpreters to use induced fractures and borehole breakouts to constrain minimum and maximum horizontal stress magnitudes alongside natural fracture characterisation.
Measurable Competency Assessment: Providers must evaluate participants through blind-well interpretation capstone tests, benchmarking individual fracture counts, azimuth accuracy (within $\pm 5^\circ$), and classification precision against senior specialist baselines.
Organisations ready to standardise their subsurface evaluation workflows and eliminate interpretation errors across asset teams can review the structured syllabus and delivery options for Borehole Image Logs for Fracture Detection Training by Institute For Oil & Gas Training. Enrolling operational geoscientists, petrophysicists, and reservoir engineers in the Borehole Image Logs for Fracture Detection Training Course equips technical staff with repeatable quality-control protocols, reducing third-party consulting spend by $50,000 to $120,000 per appraisal campaign while accelerating well-placement decisions.
Evaluating Training ROI and Workforce Performance Metrics
To justify training expenditure to executive leadership, HR and technical managers track three post-training performance indicators over a 6-to-12-month horizon:
Internal QC Self-Sufficiency Rate: Measures the percentage of newly acquired borehole image logs audited and interpreted in-house without external service-company consulting contracts. Moving from 20% to 80% internal capability typically recovers training costs within a single multi-well drilling programme.
Wellbore Stability and Geomechanical Incident Reduction: Tracks reductions in stuck-pipe events and lost-circulation incidents resulting from real-time identification of induced fractures and stress orientations in offset wells.
DFN Model Calibration Cycle Time: Measures the elapsed days between wireline log acquisition and delivery of a validated fracture intensity and orientation model to reservoir simulation teams, directly compressing field development decision timelines.
Frequently Asked Questions
What is Oil & Gas Borehole Imaging used for in reservoir evaluation?
Oil & Gas Borehole Imaging provides high-resolution, 360-degree micro-resistivity and ultrasonic acoustic visualisations of the wellbore wall to identify structural dips, fault zones, sedimentary facies, and natural fracture networks. Through specialised programmes delivered by the Institute For Oil & Gas Training, subsurface teams use these image logs to distinguish open conductive fractures from drilling-induced tensile failures, improving discrete fracture network modelling and horizontal well placement.
How does borehole image interpretation differ from conventional wireline logging?
Conventional triple-combo wireline logs average rock properties vertically over 0.5 to 1.0 metres, whereas Oil & Gas Borehole Imaging resolves geological and geomechanical features down to 5 millimetres. Practical training from the Institute For Oil & Gas Training equips geoscientists to analyse azimuthal resistivity and acoustic amplitude contrasts, uncovering thin-bedded pay zones, secondary vuggy porosity, and in-situ stress orientations that standard logs miss.
Which subsurface professionals benefit most from borehole image log training?
Operations geologists, petrophysicists, reservoir engineers, and geomechanics specialists benefit directly from structured competency development in Oil & Gas Borehole Imaging. The Institute For Oil & Gas Training designs industry-driven curricula for multidisciplinary asset teams so personnel can independently quality-control vendor dip picks, calibrate core data, and reduce reliance on external interpretation consultants.
What is the difference between micro-resistivity and ultrasonic acoustic borehole imagers?
Micro-resistivity imagers press pad-mounted electrode arrays against the borehole wall to capture sub-centimetre electrical contrasts in water-based muds, while ultrasonic televiewers emit rotating acoustic pulses to achieve full 360-degree wellbore coverage in both water-based and oil-based muds. In Oil & Gas Borehole Imaging workflows taught by the Institute For Oil & Gas Training, specialists combine both datasets to measure true fracture aperture and evaluate borehole breakout geometry.
How do organisations measure the ROI of corporate borehole imaging training?
Upstream energy companies measure the return on investment from Oil & Gas Borehole Imaging training by tracking reductions in third-party consulting expenditure, faster log-to-model turnaround times, and lower non-productive drilling time from wellbore instability. Corporate programmes at the Institute For Oil & Gas Training align technical workstation exercises with measurable operational KPIs, enabling teams to audit raw image logs in-house and improve field development accuracy.
Related training courses
Borehole Image Logs for Fracture Detection Training Course
- Specialisation
- Oil & Gas Borehole Imaging
- Duration
- 5 days · 15 CPD hours
Borehole Image Applications for Reservoir Characterization Training Course
- Specialisation
- Oil & Gas Borehole Imaging
- Duration
- 5 days · 15 CPD hours
Borehole Image Interpretation for Bedding and Dip Analysis Training Course
- Specialisation
- Oil & Gas Borehole Imaging
- Duration
- 5 days · 15 CPD hours
More articles
Electrical Borehole Imaging Technologies Training by Institute For Oil & Gas Training
Discover the curriculum, learning outcomes, and enrollment process for the Electrical Borehole Imaging Technologies Training Course.
Read article →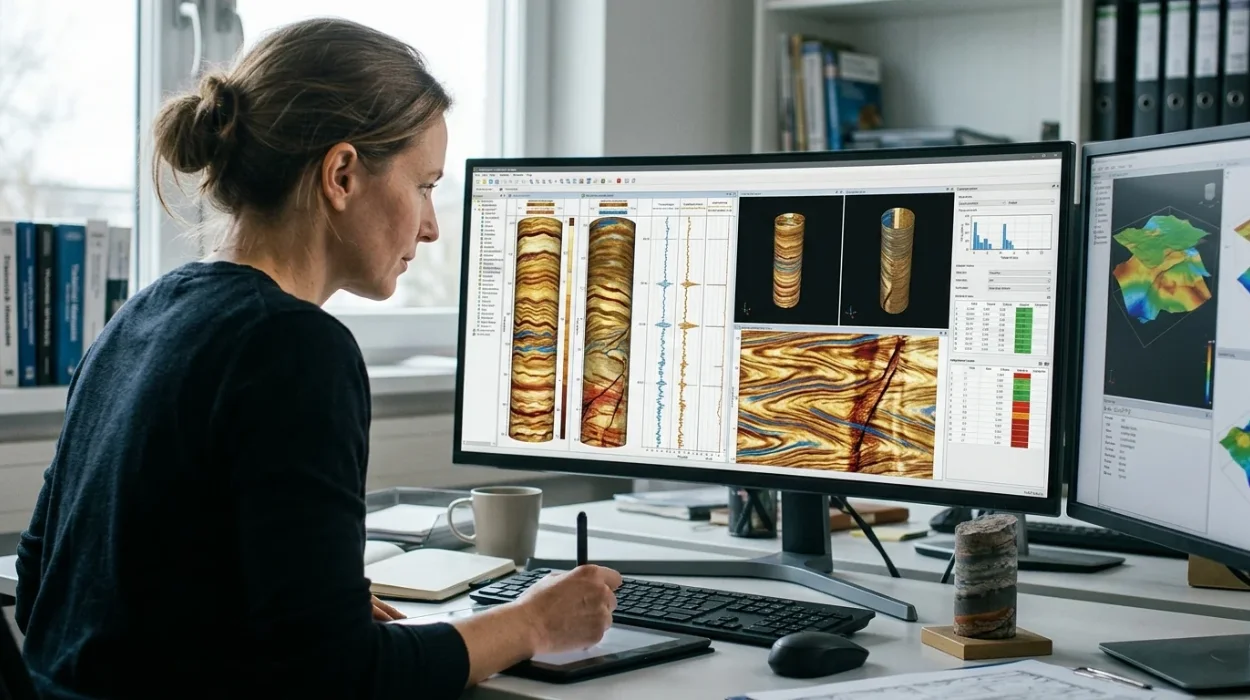
How to Evaluate Electrical Borehole Imaging Technologies and Their Applications in Formation Analysis
Master how to evaluate electrical borehole imaging technologies formation microimagers and resistivity logging tools for advanced subsurface analysis.
Read article →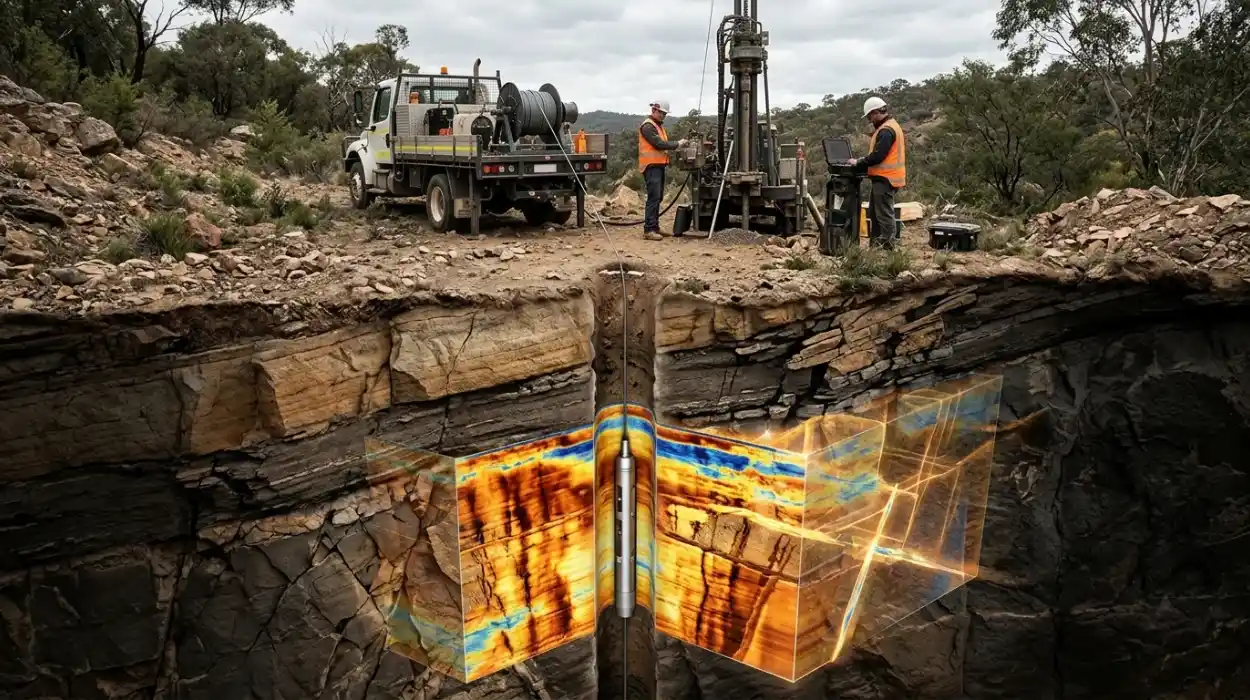
How Electrical Borehole Imaging Improves Subsurface Geological Understanding
Learn how electrical borehole imaging improves subsurface geological understanding and workforce competency through structured corporate technical training.
Read article →