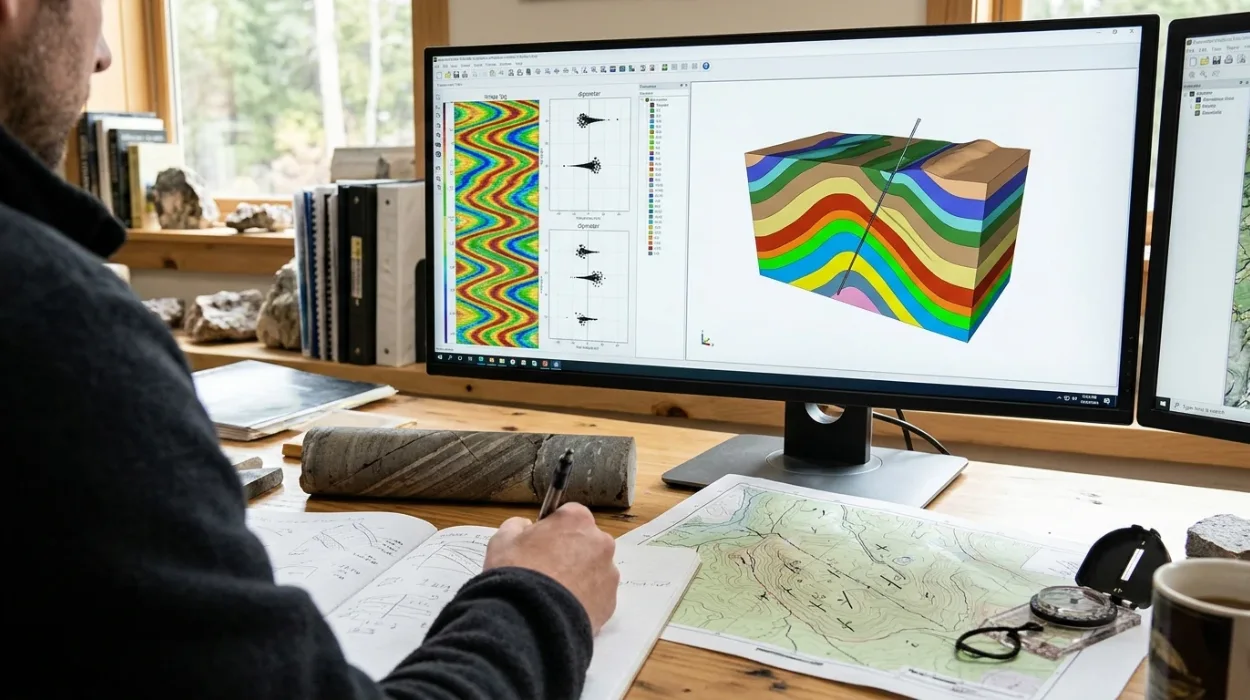
Subsurface engineering teams rely on borehole measurements to reconstruct structural geometry, identify fault blocks, and place development wells accurately. Applying dipmeter and image log data requires converting raw micro-resistivity or acoustic readings into oriented planar surfaces across a wellbore trajectory. Geoscientists and petrophysicists process these electrical and acoustic contrasts to determine true bedding orientation, separate structural tilt from sedimentary drape, and establish reliable stratigraphic correlation across complex reservoirs.
Before executing quantitative structural workflows, engineering leads must establish foundational clarity on why dipmeter and image logs matter in structural and sedimentary analysis across exploration and development assets. High-resolution borehole datasets bridge the scale gap between core plugs and surface seismic surveys, capturing centimetre-scale structural features that seismic grids miss entirely. When technical teams misinterpret dip azimuth or fail to remove borehole deviation effects, well trajectories miss target zones and structural cross-sections become distorted.
How Do Geoscientists Process Raw Borehole Data for Formation Dip Measurement?
Geoscientists process raw borehole data for formation dip measurement by calibrating multi-pad micro-resistivity or acoustic transit-time curves, correcting for tool orientation and borehole deviation, and correlating planar inflection points across azimuthal sensors to calculate true dip angle and azimuth.
Raw dipmeter log analysis begins with quality control of caliper, accelerometer, and magnetometer channels. A standard four-arm or six-arm dipmeter records micro-resistivity curves from pads pressed against the borehole wall. Each pad samples formation conductivity at vertical intervals as fine as 2.5 millimetres.
Tool orientation sensors record pad-one azimuth relative to magnetic north, along with tool tilt and relative bearing. Processing software applies magnetic declination corrections to convert magnetic azimuth into true geographic north. Accelerometer data removes irregular tool motion, commonly called stick-and-pull, which otherwise stretches or compresses depth intervals and creates false dip anomalies.
Once depth-aligned and oriented, correlation algorithms match resistivity curve inflection points across opposing pads. The plane intersecting these matched points defines the apparent dip in the borehole reference frame. Mathematical coordinate transformations then rotate the apparent dip vector using borehole deviation and borehole azimuth surveys to output true formation dip measurement in geographic coordinates.
Borehole image logs extend this workflow by increasing azimuthal coverage from discrete pad traces to continuous 360-degree wellbore wall maps. Electrical imagers deploy hundreds of button electrodes across multiple articulated pads, while acoustic televiewers emit ultrasonic pulses to measure acoustic impedance and transit time. Dynamic normalisation enhances subtle conductivity or acoustic contrasts, enabling interpreters to pick sinusoidal traces manually or validate automated dip-picking algorithms across fractured, laminated, or thinly bedded intervals.
Which Dip Interpretation Techniques Separate Structural Dip from Sedimentary Features?
Dip interpretation techniques separate structural dip from sedimentary features by filtering out high-angle cross-bedding and fault drag, isolating low-dispersion shale-bedding intervals, and applying stereonet rotations or cumulative dip plots to establish baseline tectonic tilt across the reservoir.
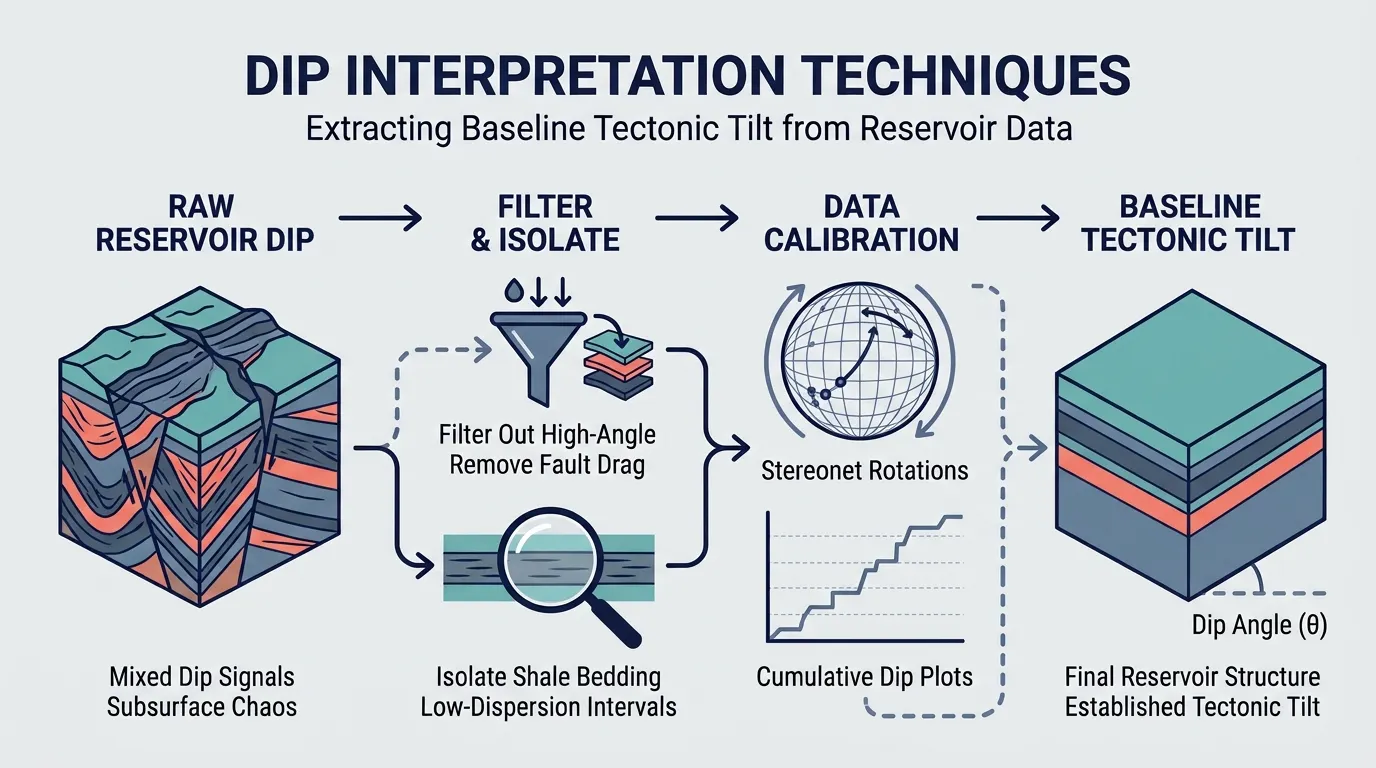
Raw dip picks contain a mixture of tectonic deformation, depositional geometry, and drilling-induced artifacts. Blindly averaging all dip vectors produces inaccurate structural maps. Interpreters apply structured dip interpretation techniques to classify events by geological origin before building structural frameworks.
Green, Red, Blue, and Yellow Tadpole Patterns
Tadpole plots display dip magnitude on the horizontal axis and depth on the vertical axis, with a tail pointing toward the dip azimuth. Classification relies on vertical dip trends across distinct lithological units:
Green Patterns (Constant Dip and Azimuth): Low-energy mudstones and marine shales deposit horizontally. Uniform dip magnitude and azimuth across thick shale intervals represent regional structural dip.
Red Patterns (Increasing Dip with Depth): Upward-decreasing dip angles at constant azimuth indicate drape over underlying reefal buildups, differential compaction over sand channels, or drag adjacent to normal faults.
Blue Patterns (Decreasing Dip with Depth): Downward-decreasing dip angles signify prograding deltaic foresets, cross-bedding within fluvial channels, or angular unconformities.
Yellow Patterns (Random Scatter): High dispersion in dip magnitude and azimuth reflects chaotic slumping, brecciated fault zones, conglomerates, or poor pad contact in washed-out boreholes.
Stereonet Analysis and Structural Removal
To analyse paleocurrent directions or depositional architecture, interpreters plot bedding orientation vectors on equal-area stereonets. Rotating the structural dip vector back to horizontal restores the original depositional geometry. Removing a 22-degree structural tilt toward the northeast transforms apparent southwest-dipping foresets into true paleocurrent transport directions, preventing errors in reservoir sand-body trend prediction.
Cumulative Dip and Vector Plots
Cumulative dip plots sum dip magnitudes sequentially against depth. Straight line segments on a cumulative plot define structural domains with consistent tectonic tilt. Sharp inflection points pinpoint unconformities, fault planes, or fold hinges where structural blocks shift orientation.
How Do Dipmeter and Image Log Methods Compare for Structural Mapping?
Dipmeter and image log methods differ in spatial resolution, borehole coverage, and analytical workflows; dipmeters provide rapid automated structural dip trends across thick sections, whereas borehole image logs deliver high-resolution azimuthal visualisation required to resolve faults, fractures, and complex stratigraphy.
Selecting the appropriate logging and interpretation methodology depends on reservoir heterogeneity, mud system conductivity, and structural complexity. Technical managers evaluate these methods across resolution, coverage, processing turnaround, and geological deliverables before committing logging budgets or training resources.
Evaluation Attribute | Multi-Arm Dipmeter Logs | Electrical Borehole Image Logs | Acoustic Borehole Image Logs |
Azimuthal Borehole Coverage | 10% to 25% via 4 to 6 discrete pads | 50% to 80% depending on borehole diameter | 100% continuous 360-degree wellbore scan |
Vertical Resolution | 5 mm to 10 mm | 2.5 mm to 5 mm | 5 mm to 10 mm |
Primary Mud Compatibility | Water-based mud (conductive) | Water-based mud; specialized oil-based imagers exist | Both water-based and oil-based muds |
Core Structural Deliverable | Macro-scale structural dip and fold geometry | Micro-faults, open vs. healed fractures, thin-bed dips | Breakout orientation, stress regime, fracture aperture |
Interpretation Workflow Speed | Fast automated correlation (hours per 1,000 m) | Moderate to slow manual/hybrid picking (days per 1,000 m) | Moderate manual/hybrid picking (days per 1,000 m) |
Primary Limitation | Misses small-scale fractures and subtle stratigraphic truncations | Reduced pad contact in rugose or ovalised holes | Sensitive to mud weight, solids content, and tool eccentering |
Dipmeter log analysis remains efficient for regional structural dip analysis across thick, clastic sequences where wellbore conditions are uniform. However, when wells penetrate naturally fractured carbonates, sub-seismic fault zones, or thinly laminated turbidites, electrical and acoustic image logs provide the azimuthal continuity needed to distinguish open conductive fractures from cemented healed fractures.
What Is the Step-by-Step Workflow to Evaluate Geological Structures?
Evaluating geological structures from borehole logs follows a five-stage workflow: verifying borehole deviation and tool orientation, identifying green-pattern structural dip zones, mapping fault and fold discontinuities, integrating core and seismic horizons, and updating the three-dimensional structural reservoir model.
Executing a repeatable evaluation workflow eliminates subjective picking bias and ensures consistency across multi-well field studies.
Audit Raw Curves and Borehole Geometry: Inspect caliper logs for washouts or key-seating. Confirm that deviation surveys align with accelerometer data and verify magnetic declination settings for the specific field coordinates and logging date.
Isolate Structural Dip Domains: Filter dip picks using gamma-ray and density-neutron logs to isolate clean shale intervals. Extract green-pattern tadpole clusters to establish baseline structural dip across each stratigraphic unit.
Identify Structural Discontinuities: Scan image logs and tadpole plots for abrupt azimuth reversals, red-pattern drag zones, and sinusoidal fault planes. Measure fault plane strike and dip directly from image sinusoids and classify throw direction using drag orientation.
Determine In-Situ Stress Orientation: Map drilling-induced tensile fractures and borehole breakouts on image logs. Breakout azimuths indicate minimum horizontal stress orientation, while tensile fractures align with maximum horizontal stress, informing hydraulic fracturing and wellbore stability models.
Reconcile with Seismic and Offset Wells: Tie interpreted structural dip vectors and fault intersections to time-depth converted seismic sections. Use dip-domain boundaries to constrain cross-section construction and refine stratigraphic correlation between adjacent wells.
How Should Organisations Address Workforce Skill Gaps in Subsurface Dip Interpretation?
Organisations close workforce skill gaps in subsurface dip interpretation by benchmarking geoscience competencies, replacing passive theory with workstation-based practical training, and deploying structured programmes such as the Dipmeter and Image Log Applications Training by Institute For Oil & Gas Training to standardise interpretation workflows.
Many exploration and production operators collect high-resolution borehole image logs at costs exceeding $50,000 per well, yet underutilise the datasets because asset teams lack hands-on interpretation proficiency. Junior and mid-career geoscientists frequently rely on default automated dip-picking outputs without validating pad contact, mud-filtrate invasion effects, or structural artifacts.
Human resources directors and subsurface team leads face measurable operational risks when dip interpretation skills remain concentrated in a single senior specialist. Turnaround times for well-placement decisions stall, structural models carry unquantified uncertainty, and costly sidetracks occur due to misidentified fault drag.
Addressing these capability gaps requires evaluating corporate training frameworks against operational complexity and asset maturity. When organisations select a Dipmeter and Image Log Applications Training by Institute For Oil & Gas Training, technical managers establish a uniform competency baseline across petrophysicists, structural geologists, and reservoir engineers.
Training Evaluation Criteria | Self-Paced E-Learning Modules | Generic Academic Short Courses | Practical Workstation Corporate Training |
Hands-On Software Application | Low; relies on static slides and pre-picked examples | Moderate; uses simplified textbook datasets | High; executes full QC, picking, and stereonet workflows on real field logs |
Workflow Standardisation | Low; individual learners interpret concepts differently | Moderate; covers theory without company-specific templates | High; aligns asset teams around unified QC and classification rules |
Time to Operational Competency | 6 to 12 months with heavy senior mentoring required | 3 to 6 months of post-course trial and error | Immediate application within 2 to 4 weeks post-training |
Measurable Business KPIs | Course completion rates only | Quiz scores and attendance certificates | Reduced structural model revisions, faster post-well log turnaround, fewer sidetracks |
Effective corporate capability building integrates real field datasets, multi-well correlation exercises, and fault-seal evaluation scenarios. Enrolling subsurface teams in the Dipmeter and Image Log Applications Training Course equips participants to audit vendor-processed logs independently, build defensible structural cross-sections, and deliver validated dip inputs directly into static geomodels.
What Metrics Measure the ROI of Technical Training in Structural Log Analysis?
Organisations measure the return on investment of technical training in structural log analysis by tracking reductions in well-placement sidetracks, faster post-logging interpretation turnaround times, decreased reliance on external consulting contractors, and improved accuracy in structural reservoir volume estimates.
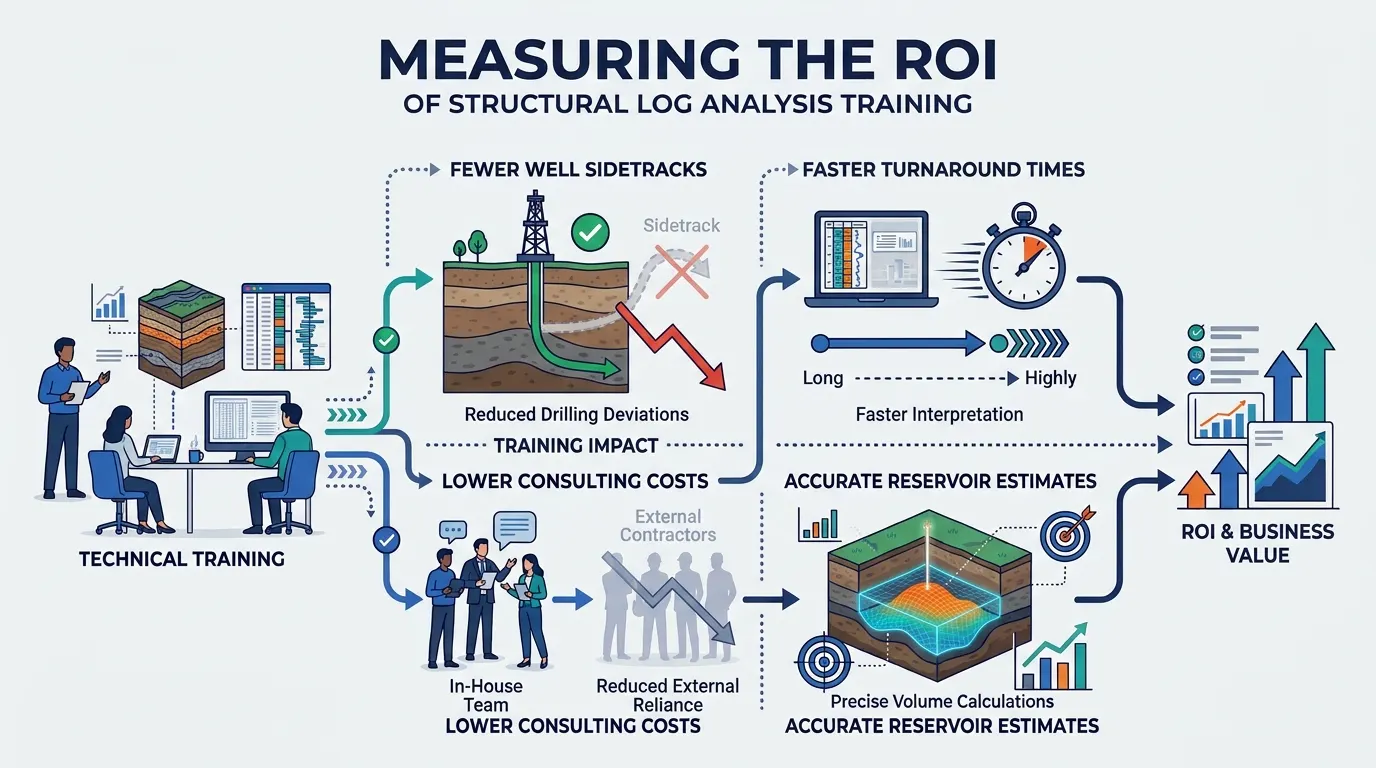
HR teams and engineering managers justify technical training budgets by linking learning outcomes directly to operational performance indicators. Evaluating training impact requires tracking specific pre- and post-training metrics across active drilling campaigns:
Interpretation Turnaround Time: Measure the hours elapsed between receiving final field log deliverables and delivering validated structural dip and fracture picks to the geomodelling team. Competent in-house teams reduce turnaround from weeks to under 48 hours.
External Consulting Spend Reduction: Track annual expenditure on third-party dip-processing and structural consulting contracts. Upskilling internal petrophysicists and geologists lowers external vendor dependency by 30% to 60% within two quarters.
Well Trajectory and Sidetrack Variance: Audit the frequency of geological sidetracks caused by unexpected fault intersections or bedding dip changes. Accurate dip-guided geosteering and structural mapping prevent non-productive rig time valued at $100,000 or more per day.
Geomodel Revision Cycles: Monitor how often static structural models require major horizon re-interpretations during history matching. Consistent structural dip analysis reduces structural uncertainty early in field development, streamlining reservoir simulation and well planning.
Frequently Asked Questions
What is oil and gas borehole imaging used for in reservoir evaluation?
Oil & Gas Borehole Imaging generates high-resolution micro-resistivity or acoustic maps of the wellbore wall to identify structural dip, natural fractures, fault planes, and sedimentary features. Subsurface teams use these datasets to refine geological models, determine in-situ stress orientations, and optimise well placement across complex reservoirs.
How does acoustic borehole imaging differ from electrical borehole imaging?
Electrical borehole imaging measures formation micro-resistivity using button electrodes on pads pressed against the borehole wall, functioning best in conductive water-based muds. Acoustic borehole imaging uses ultrasonic pulses to measure acoustic impedance and transit time across a full 360-degree wellbore scan, making it suitable for both water-based and non-conductive oil-based mud systems.
Who should attend training in oil and gas borehole imaging?
Petrophysicists, structural geologists, sedimentologists, reservoir engineers, and drilling specialists benefit directly from structured Oil & Gas Borehole Imaging programmes. Practical training delivered by the Institute For Oil & Gas Training equips subsurface professionals to perform quality control on raw logs, pick structural dips accurately, and integrate image interpretations into static geomodels.
How do borehole image logs improve fracture characterisation and well stability?
Borehole image logs distinguish open, conductive fractures from cemented or healed fractures, enabling reservoir engineers to predict fluid flow pathways and permeability anisotropy. Additionally, identifying borehole breakouts and drilling-induced tensile fractures reveals horizontal stress directions, which helps drilling teams prevent wellbore collapse and mitigate lost circulation risks.
What skills are required to interpret borehole image log data accurately?
Accurate interpretation requires proficiency in raw curve quality control, depth-matching, dip-picking workflows, stereonet analysis, and separating tectonic tilt from depositional cross-bedding. Through hands-on workstation exercises, the Institute For Oil & Gas Training develops these applied competencies so asset teams can reduce reliance on external consultants and accelerate post-logging decision-making.
Related training courses
Borehole Image Logs for Fracture Detection Training Course
- Specialisation
- Oil & Gas Borehole Imaging
- Duration
- 5 days · 15 CPD hours
Borehole Image Analysis for Structural Geology Training Course
- Specialisation
- Oil & Gas Borehole Imaging
- Duration
- 5 days · 15 CPD hours
Borehole Image Applications in Wellbore Stability Analysis Training Course
- Specialisation
- Oil & Gas Borehole Imaging
- Duration
- 5 days · 15 CPD hours
More articles
Electrical Borehole Imaging Technologies Training by Institute For Oil & Gas Training
Discover the curriculum, learning outcomes, and enrollment process for the Electrical Borehole Imaging Technologies Training Course.
Read article →
How to Evaluate Electrical Borehole Imaging Technologies and Their Applications in Formation Analysis
Master how to evaluate electrical borehole imaging technologies formation microimagers and resistivity logging tools for advanced subsurface analysis.
Read article →
How Electrical Borehole Imaging Improves Subsurface Geological Understanding
Learn how electrical borehole imaging improves subsurface geological understanding and workforce competency through structured corporate technical training.
Read article →