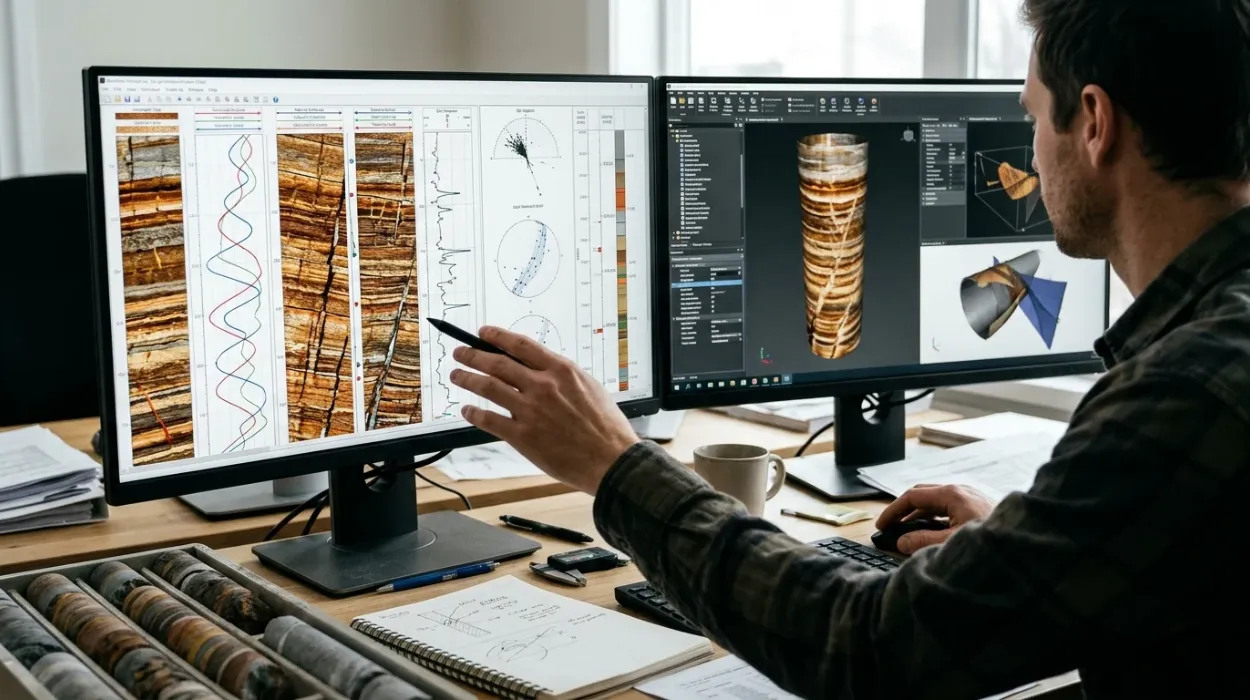
Subsurface asset teams rely on high-resolution electrical and acoustic logs to resolve structural and stratigraphic features below the resolution of conventional wireline tools. Complex reservoirs—such as fractured carbonates, thinly bedded turbidites, and faulted siliciclastics—generate high-density datasets exceeding 1,000 image picks per 100 metres of wellbore. Processing these logs requires deterministic workflows that convert raw pad-conductivity or transit-time measurements into calibrated geological models. Geoscientists who rely solely on automated dip-picking algorithms introduce structural bias into static reservoir models, resulting in suboptimal well placement and inaccurate volumetric estimates.
Building internal technical capability starts with understanding why advanced borehole image interpretation matters in subsurface evaluation across exploration and field development lifecycles. Once technical managers recognize the operational risk of misinterpreting high-angle structural dips or drilling-induced artifacts, the focus shifts to selecting the right analytical frameworks and workforce upskilling models. Technical leaders and HR learning partners must evaluate whether to rely on external service-company processing, self-paced software tutorials, or structured advanced borehole image interpretation training to close internal competency gaps.
What Is the Standard Workflow for Interpreting Complex Borehole Image Data?
Applying advanced interpretation techniques to complex borehole image data requires a sequential five-stage workflow: quality control and environmental correction, static and dynamic image normalization, manual and semi-automated dip classification, structural and stratigraphic integration, and validation against core and dynamic production data.
Executing this sequence prevents processing artifacts from propagating into three-dimensional geological models. Each stage isolates specific physical signals from borehole wall noise, ensuring that structural and sedimentological interpretations reflect true subsurface heterogeneity rather than tool mechanics.
Stage 1: Data Quality Control and Speed Correction
Raw borehole image logs contain acquisition artifacts caused by tool sticking, pad lift-off, and uneven cable tension. Interpreters begin by auditing accelerometer curves (Z-axis acceleration) and caliper logs to identify zones of stick-and-pull motion. Applying speed correction algorithms realigns depth-shifted pad buttons before generating visual tracks. If borehole rugosity exceeds 2.5 centimetres of washout on dual-caliper logs, interpreters flag those intervals as low-confidence zones to prevent false fracture picking.
Stage 2: Static and Dynamic Normalization
Static normalization applies a single colour-scale histogram across the entire logged interval, preserving absolute resistivity or acoustic amplitude contrasts. Geoscientists use static images to identify gross lithological boundaries, shale-to-sand ratios, and large-scale diagenetic zones. Dynamic normalization recalculates the colour histogram within a moving vertical window, typically spanning 0.5 to 2.0 metres. Dynamic tracks amplify subtle millimeter-scale features, revealing cross-bedding, thin laminations, and hairline micro-fractures inside otherwise homogeneous intervals.
Stage 3: Dip Classification and Artifact Filtering
Interpreters fit sinusoidal curves across planar features intersecting the cylindrical wellbore to calculate true dip magnitude and dip azimuth. Advanced interpretation separates geological features from drilling-induced artifacts:
Drilling-Induced Tensile Fractures (DITFs): Appear as paired, vertical-to-subvertical conductive traces oriented 180 degrees apart, aligned with the maximum horizontal stress direction ($S_{Hmax}$).
Borehole Breakouts: Manifest as broad, out-of-focus conductive zones on opposite sides of the borehole wall, oriented parallel to the minimum horizontal stress ($S_{hmin}$).
Natural Open Fractures: Display continuous sinusoidal traces across multiple pads with low resistivity (in water-based mud) or low acoustic amplitude, cross-cutting host rock bedding planes.
How Do Geoscientists Separate Structural Overprint from Sedimentary Architecture?
Geoscientists separate structural overprint from sedimentary architecture by establishing structural dip baselines in laminated mudstones, applying stereonet rotation to remove tectonic tilt, and classifying primary sedimentary structures and paleocurrent orientations within restored depositional reference frames.
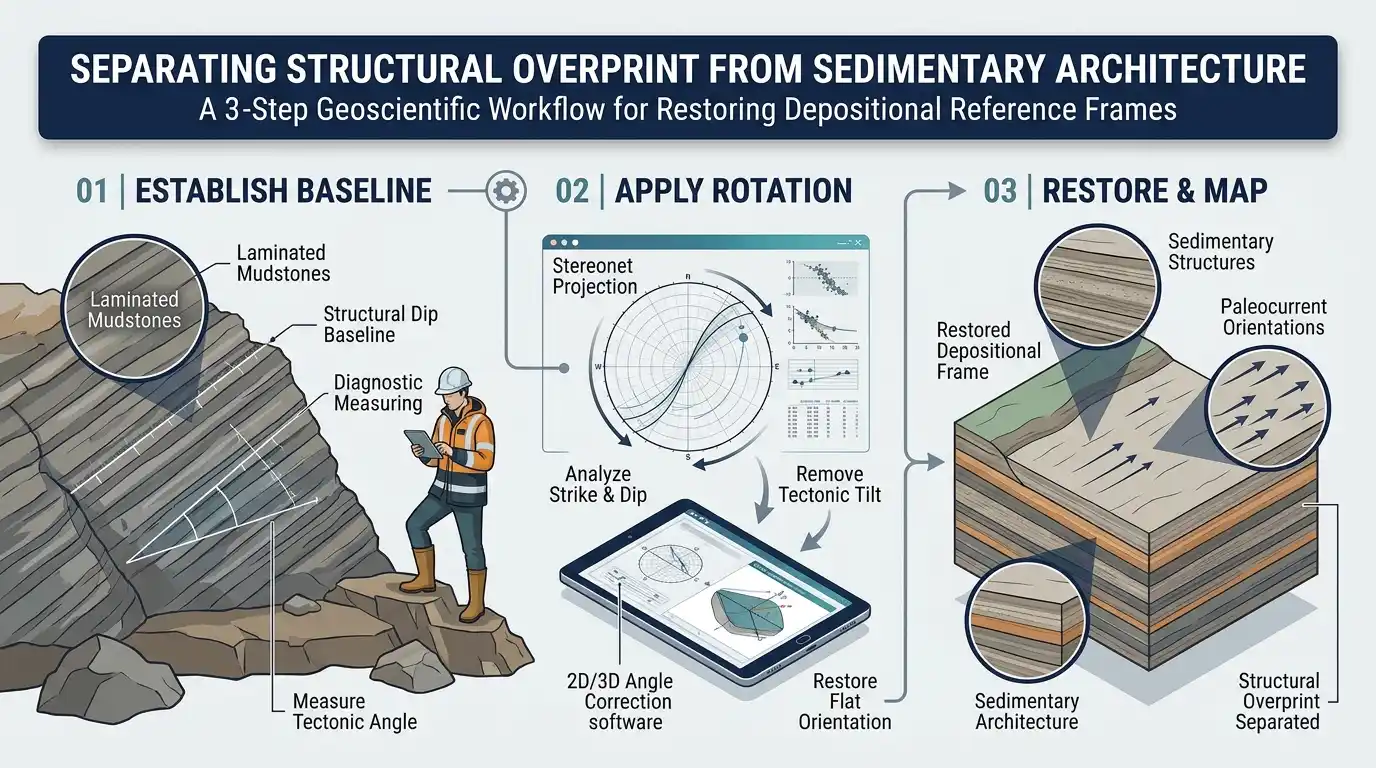
In structurally deformed basins, tectonic folding and fault drag rotate primary depositional surfaces, obscuring original transport directions. Failing to remove structural dip leads to erroneous paleocurrent vectors and misaligned channel or shoreface body orientations in static reservoir models.
Structural Dip Removal and Stereonet Restoration
Interpreters isolate low-energy, finely laminated shale or mudstone intervals where depositional surfaces were originally horizontal. Calculating the mean dip magnitude and azimuth of these hemipelagic drapes establishes the local structural tilt. Using Schmidt or Wulff stereographic projections, the interpreter rotates all measured cross-bedding and foreset dips back to the paleo-horizontal plane. This mathematical restoration exposes true depositional dip angles, typically ranging between 15 and 32 degrees for subaqueous sand dunes and aeolian cross-strata.
Sedimentary Structures and Paleocurrent Mapping
Once structural tilt is removed, geoscientists execute detailed bedding interpretation to classify depositional facies at the centimetre scale. Planar cross-bedding, trough cross-stratification, climbing ripples, and bioturbated intervals exhibit distinct sinusoidal patterns and resistivity textures on dynamic micro-resistivity images. Aggregating the restored azimuths of unidirectional foresets enables accurate paleocurrent mapping, defining sediment dispersal pathways, sand-body elongation axes, and reservoir connectivity trends between appraisal wells.
Integrated Fracture Analysis and Geomechanics
In naturally fractured reservoirs, fracture analysis quantifies fracture intensity ($P_{10}$ linear frequency and $P_{32}$ area per unit volume), aperture distribution, and kinematic orientation. Interpreters distinguish between conductive (open, fluid-bearing) fractures and resistive (cement-filled or healed) fractures by cross-referencing micro-resistivity images with acoustic borehole televiewer logs and Stoneley wave permeability indicators. Integrating open-fracture orientations with in-situ stress tensors derived from DITFs and breakouts identifies critically stressed fractures that dominate fluid flow during production.
Which Methodologies Best Support Multi-Scale Reservoir Characterisation?
Effective multi-scale reservoir characterisation requires integrating borehole image facies with conventional triple-combo wireline logs, whole-core descriptions, and nuclear magnetic resonance data to bridge the vertical resolution gap between centimetre-scale borehole walls and decametre-scale seismic grids.
Borehole imaging tools sample the wellbore perimeter at a vertical resolution of 5 millimetres, whereas standard porosity and resistivity logs average formation properties over 30 to 60 centimetres. Reconciling these scales prevents net-to-gross underestimation in laminated pay zones.
Electrofacies Upscaling and Net-Pay Calibration
Geoscientists group image-derived textures, dip patterns, and pad resistivity distributions into discrete image electrofacies. By calibrating these electrofacies against core plug porosity and permeability measurements, petrophysicists compute high-resolution sand counts across thinly bedded intervals. In turbidite sequences where individual sand beds measure 2 to 10 centimetres thick, image-based sand counting routinely increases calculated net pay by 15% to 35% compared to conventional density-neutron cutoffs.
Comparison of Borehole Imaging Technologies and Interpretation Methods
Selecting the appropriate interpretation workflow depends on mud system chemistry, borehole wall condition, and primary geological objectives. The table below evaluates standard borehole imaging modalities and their analytical trade-offs across complex reservoir environments.
Imaging Modality / Method | Mud System Compatibility | Vertical Resolution | Primary Geological Strength | Key Analytical Limitation |
Micro-Resistivity (WBM) | Water-Based Mud (Conductive) | 5 mm | High-definition sedimentary structures, thin-bed sand count, open vs. healed fractures | Fails in oil-based mud; sensitive to pad contact loss in washed-out holes |
Oil-Based Mud Imagers (OBMI) | Oil-Based / Synthetic Mud (Non-conductive) | 10–15 mm | Structural dip determination, gross lithology, fault-zone identification | Lower azimuthal coverage (30%–45%); struggles to resolve hairline micro-fractures |
Ultrasonic Borehole Televiewer (UBI) | Water-Based and Oil-Based Muds | 5–10 mm | 360-degree borehole geometry, breakout quantification, fracture analysis | Sensitive to heavy mud weight (>14 ppg) and mud-cake acoustic attenuation |
LWD Azimuthal Density/Resistivity | All Mud Systems (Real-Time) | 25–75 mm | Real-time geosteering, structural dip tracking, wellbore stability monitoring | Coarse resolution unsuitable for detailed paleocurrent mapping |
How Do Corporate Learning Models Compare for Upskilling Subsurface Teams?
Corporate learning models for borehole image interpretation include vendor-led software tutorials, self-paced digital libraries, external service-company outsourcing, and cohort-based applied technical workshops, with applied workshops delivering the highest competency retention and operational ROI for multidisciplinary asset teams.
HR directors and geoscience managers face recurring skill gaps caused by senior specialist retirements and increasing reservoir complexity. Selecting a training delivery model requires evaluating workflow transferability, software neutrality, and measurable productivity gains rather than seat-time completion metrics.
Evaluation of Workforce Upskilling Approaches
Organizations typically weigh four delivery models when building internal reservoir characterisation capabilities:
Vendor-Led Software Training: Focuses strictly on button-clicking mechanics within a single proprietary software platform. Geoscientists learn menu navigation within 3 to 5 days, but lack the sedimentological and structural judgment required to quality-control automated dip picks or resolve ambiguous image textures.
Self-Paced E-Learning Modules: Offers low upfront cost ($300 to $800 per user) and flexible scheduling. Completion rates across technical subsurface staff average 22% to 30%, and learners rarely develop proficiency in multi-well correlation or stereonet structural restoration without live instructor feedback.
Service-Company Interpretation Outsourcing: Transfers processing to external contractors at $8,000 to $25,000 per well. While outsourcing meets short-term deadlines, it drains internal technical institutional memory and prevents asset geologists from dynamically updating interpretations as new drilling data arrives.
Applied Cohort-Based Technical Training: Combines theoretical rock physics, hand-picking exercises on real field datasets, and multi-disciplinary integration workshops. Enrolling teams in a structured Advanced Borehole Image Interpretation Training Course builds standardized internal QC protocols across geologists, petrophysicists, and reservoir engineers.
Training Delivery Decision Framework for HR and Technical Managers
Technical leaders and learning partners must align training investments with operational bottlenecks and workforce maturity levels. The framework below guides decision-making across key organisational evaluation criteria.
Evaluation Dimension | Vendor Software Tutorials | Self-Paced Digital Courses | External Outsourcing | Applied Cohort Technical Training |
Primary Competency Built | Software UI navigation | Foundational terminology | Zero internal skill transfer | End-to-end geological & petrophysical QC |
Time to Operational Proficiency | 2–4 weeks (tool-specific only) | 3–6 months (high drop-off risk) | Immediate delivery, permanent dependency | 4–6 weeks post-workshop with mentored application |
Dataset Authenticity | Idealized synthetic demo logs | Pre-recorded static slides | Proprietary contractor workflows | Complex, noisy field logs with drilling artifacts |
Cross-Disciplinary Alignment | Single-user siloed execution | Individualized learning | Disconnected from asset team | Unifies geologists, petrophysicists, and drillers |
Measurable Business KPI | Software license utilization | Course completion rate | Deliverable turnaround time | Reduction in well placement errors & external spend |
How Do Organisations Measure the ROI of Advanced Image Interpretation Training?
Organisations measure the ROI of advanced image interpretation training through direct reductions in external consulting expenditure, decreased horizontal well sidetrack rates, improved net-pay capture in laminated reservoirs, and accelerated well-to-model turnaround times.
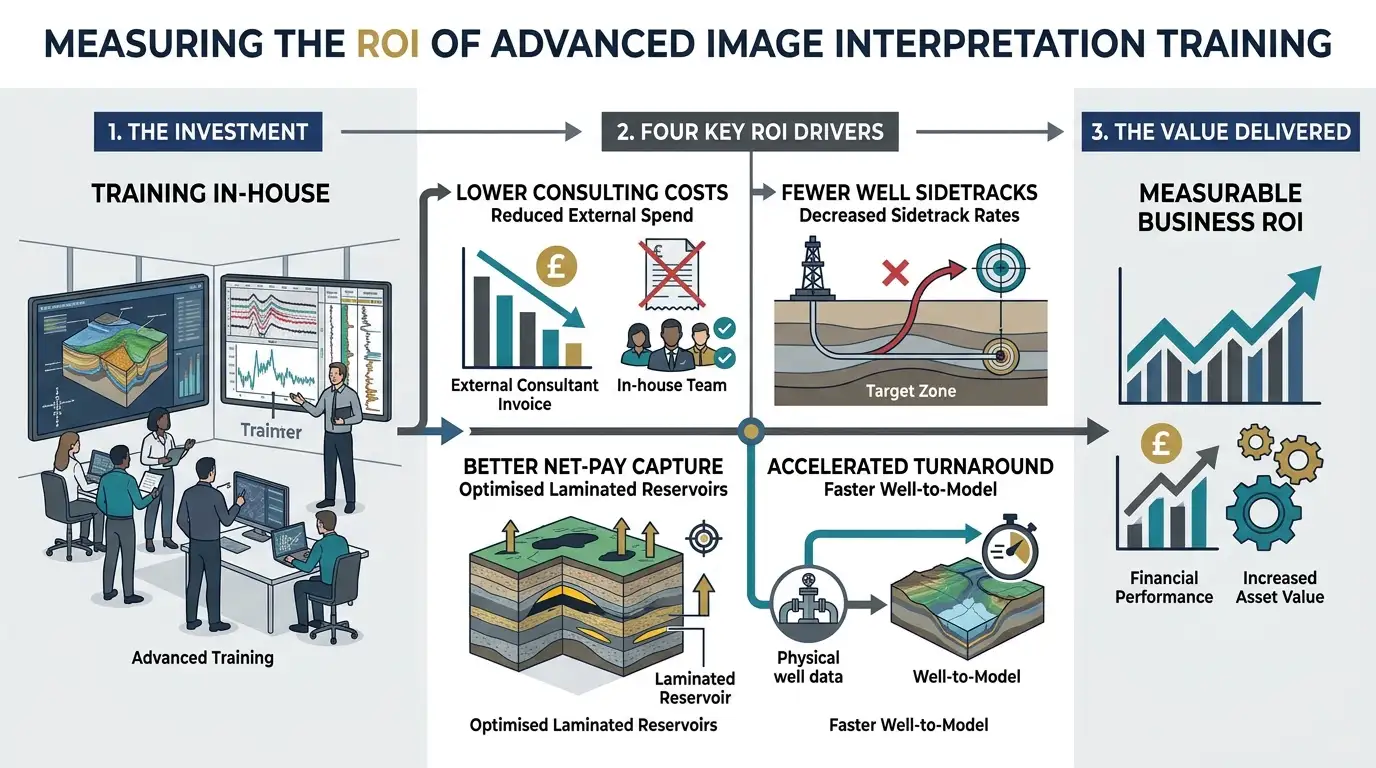
Quantifying the business impact of technical upskilling allows HR and operations leaders to justify training budgets against tangible asset performance indicators.
Direct Cost Avoidance and Turnaround Efficiency
An operating company processing 15 to 20 complex wells annually spends between $150,000 and $400,000 on third-party image processing and interpretation services. Training an internal cohort of 8 to 12 geoscientists eliminates 60% to 80% of external contractor fees within the first 12 months. Internalizing the workflow also compresses interpretation turnaround time from 3 weeks to 4 working days, enabling real-time structural adjustments during active drilling campaigns.
Subsurface Risk Reduction and Production Impact
Misinterpreting fault drag or fracture azimuth in horizontal development wells frequently forces costly mechanical sidetracks costing $1.5 million to $4 million per event. Equipping asset teams to execute rigorous fracture analysis and structural dip restoration directly reduces wellbore instability and optimizes completion stage placement. In mature fields, revisiting legacy borehole image logs with calibrated bedding interpretation workflows routinely uncovers bypassed pay zones, delivering incremental production gains without additional capital drilling expenditure.
Competency Assessment Metrics for Learning Teams
To track skill transfer systematically, corporate learning teams implement three post-training evaluation checkpoints:
30-Day Technical Audit: Blind-test evaluation where participants classify 200 pre-validated image features (separating open fractures, healed fractures, DITFs, and sedimentary cross-beds) with a minimum 85% accuracy benchmark.
60-Day Asset Integration Deliverable: Participants complete a full single-well interpretation report incorporating stereonet restoration and core calibration, peer-reviewed by a principal specialist.
90-Day Operational KPI Review: Measurement of external vendor spend reduction, well-report cycle time, and adoption of standardized company-wide dip-classification schemas across active asset teams.
Frequently Asked Questions
What is oil and gas borehole imaging used for in subsurface evaluation?
Oil and gas borehole imaging provides high-resolution electrical and acoustic visualisations of the wellbore wall to identify structural dips, natural fractures, and fine-scale sedimentary structures. Subsurface teams use these measurements to refine static reservoir models, determine paleocurrent directions, and optimise horizontal well placement. The Institute For Oil & Gas Training incorporates practical borehole imaging workflows into its Oil & Gas Borehole Imaging programs to help geoscientists reduce structural uncertainty.
How do micro-resistivity and acoustic borehole imaging tools differ?
Micro-resistivity imagers measure electrical conductivity contrasts at a 5-millimetre vertical resolution in conductive water-based muds, making them ideal for detailed thin-bed sand counting and facies analysis. Ultrasonic acoustic televiewers measure transit time and amplitude across 360 degrees in both water-based and oil-based muds, excelling at borehole breakout quantification and open-fracture detection. Selecting the appropriate modality through structured Oil & Gas Borehole Imaging methodologies ensures accurate data acquisition across varying drilling fluid environments.
How does borehole image interpretation improve naturally fractured reservoir characterisation?
Borehole image interpretation distinguishes conductive, fluid-bearing natural fractures from resistive, cement-filled fractures and drilling-induced tensile cracks. Geoscientists quantify fracture intensity, aperture size, and azimuth to map permeable pathways and predict in-situ stress orientations. Training delivered by the Institute For Oil & Gas Training equips asset teams with Oil & Gas Borehole Imaging techniques to integrate fracture networks with dynamic production and core data.
Why is manual quality control necessary when processing borehole image logs?
Automated dip-picking algorithms frequently misclassify tool stick-and-pull artifacts, washouts, and drilling-induced breakouts as true geological bedding or natural fractures. Manual quality control and stereonet structural restoration ensure that tectonic overprint is removed before calculating depositional paleocurrent vectors. Applying rigorous validation standards within Oil & Gas Borehole Imaging workflows prevents structural bias from propagating into field development plans.
Who benefits from corporate training in oil and gas borehole imaging?
Geologists, petrophysicists, reservoir engineers, and drilling specialists benefit from structured upskilling in borehole image processing, dip classification, and multi-scale log integration. Building internal competency reduces reliance on third-party service contractors and shortens well-to-model turnaround times during active drilling campaigns. The Institute For Oil & Gas Training designs its Oil & Gas Borehole Imaging programs to close technical skill gaps across multidisciplinary subsurface teams.
Related training courses
Borehole Image Applications in Sedimentology Training Course
- Specialisation
- Oil & Gas Borehole Imaging
- Duration
- 5 days · 15 CPD hours
Borehole Image Applications in Wellbore Stability Analysis Training Course
- Specialisation
- Oil & Gas Borehole Imaging
- Duration
- 5 days · 15 CPD hours
Borehole Image Applications for Reservoir Characterization Training Course
- Specialisation
- Oil & Gas Borehole Imaging
- Duration
- 5 days · 15 CPD hours
More articles
Electrical Borehole Imaging Technologies Training by Institute For Oil & Gas Training
Discover the curriculum, learning outcomes, and enrollment process for the Electrical Borehole Imaging Technologies Training Course.
Read article →
How to Evaluate Electrical Borehole Imaging Technologies and Their Applications in Formation Analysis
Master how to evaluate electrical borehole imaging technologies formation microimagers and resistivity logging tools for advanced subsurface analysis.
Read article →
How Electrical Borehole Imaging Improves Subsurface Geological Understanding
Learn how electrical borehole imaging improves subsurface geological understanding and workforce competency through structured corporate technical training.
Read article →