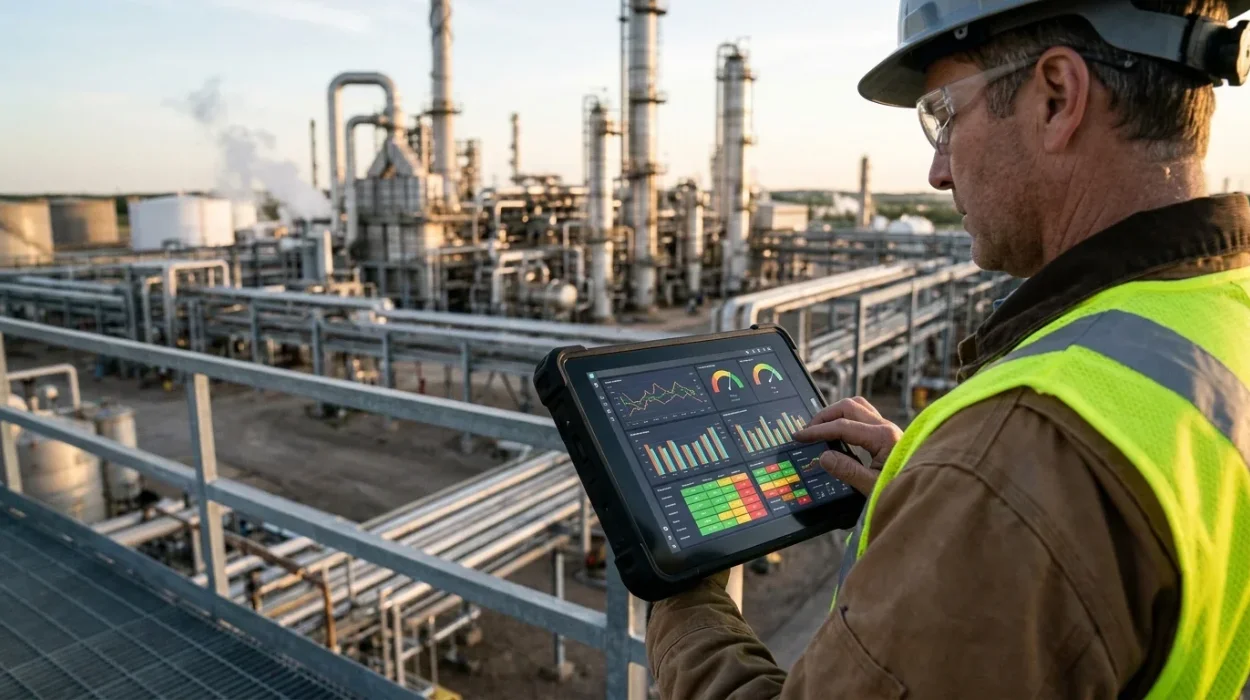
Production and cost dashboards are visual analytics systems that integrate operational metrics and financial data into unified business intelligence interfaces. They eliminate departmental data silos, standardise reporting, and provide executives with real-time performance indicators for risk management.
In upstream, midstream, and downstream operations, raw data originates from disparate sources like supervisory control and data acquisition (SCADA) networks, enterprise resource planning (ERP) platforms, and manual field logs. Production and cost dashboards consolidate these fragmented streams into central monitoring points. HR leaders and Learning and Development (L&D) managers treat dashboard literacy as a core technical competency for technical staff. Operational teams use these visual tools to evaluate lift costs, track daily barrel outputs, and identify maintenance bottlenecks before capital waste occurs.
Organisations face significant execution risks when engineers and financial analysts lack data visualization skills. Without structured visual reports, decision-makers rely on static, error-prone spreadsheets that delay critical interventions. Corporate training initiatives focus on building capabilities in business intelligence tools, enabling teams to automate data ingestion and maintain rigorous metrics across assets. Standardised reporting frameworks support rapid executive alignment, directly lowering operating expenses per barrel of oil equivalent ($/BOE).
How Do Production and Cost Dashboards Work in Corporate Environments?
Dashboards work by connecting multi-source data repositories to interactive visual models using automated pipelines. Teams transform complex data into key performance indicators, enabling managers to analyze cost deviations and operational delays across diverse asset portfolios.
Corporate deployment follows a multi-tiered workflow managed jointly by IT infrastructure, business analytics, and operational leadership. Raw data flows from field extraction points into centralised data warehouses. Data engineers and trained analysts build robust data models using structured schemas. These models establish logical relationships between operational volume datasets and financial ledger accounts. The final reporting layer displays actionable visual components, such as trend lines, variance heatmaps, and conditional alerts, tailored to specific leadership tiers.
Technical Data Architecture Pipeline
Data Ingestion: Secure connectors pull operational data from SCADA systems, field telemetry, and accounting databases into enterprise repositories.
Data Cleaning and Transformation: Power Query processes clean unrefined inputs, standardise date formats, and resolve missing operational entries.
Data Modelling: Analysts configure star schema models, defining strict one-to-many relationships between central fact tables and dimensional lookup tables.
Metric Calculation: Analysts write Data Analysis Expressions (DAX) to compute dynamic business metrics, such as moving averages, year-over-year variances, and lease operating expenses.
Report Delivery: Automated refresh schedules publish updated dashboards to secure cloud workspaces, granting role-based access to field supervisors and board members.
Successful operational adoption requires cross-functional collaboration between field operations, financial planning, and talent development teams. Workforce upskilling ensures staff can interpret data visualizations accurately and conduct root-cause analyses independently. When personnel understand the mechanics behind dashboard visualisations, organisations reduce meeting times by 35% and shorten response times to unexpected production drops from days to hours.
How Do Organisations Implement Production and Cost Dashboard Capability Step by Step?
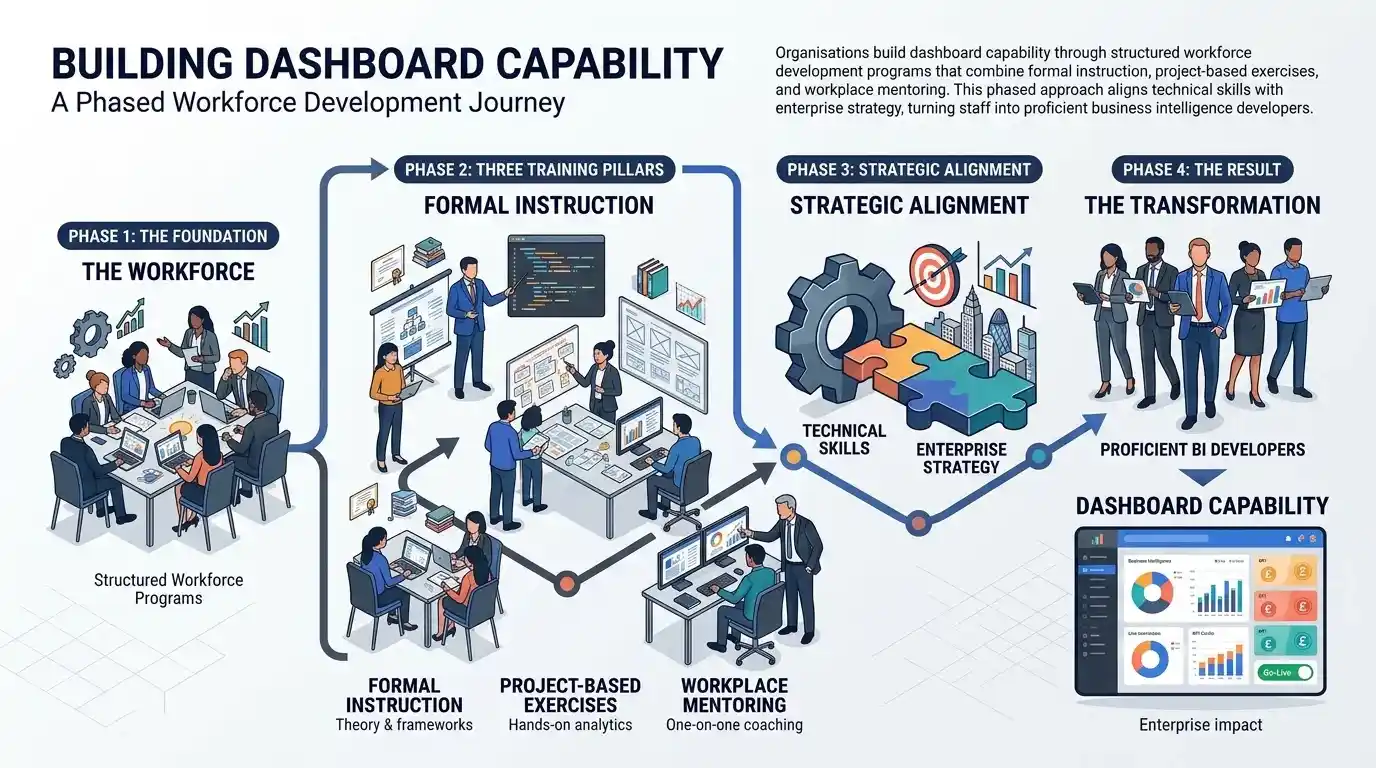
Organisations build dashboard capability through structured workforce development programs that combine formal instruction, project-based exercises, and workplace mentoring. This phased approach aligns technical skills with enterprise strategy, turning staff into proficient business intelligence developers.
Phase 1: Skill Gap Analysis and Baseline Assessment
L&D teams assess the existing technical skills of operational staff, financial controllers, and petroleum engineers. Assessments identify specific deficiencies in data modeling, statistical analysis, and business intelligence tool usage. The baseline results inform customized learning paths tailored to distinct business roles.
Phase 2: Structured Capability Development
Employees undergo intensive technical training delivered through practical workshops, hybrid modules, or instructor-led sessions. Learners master core data transformation concepts using modern business intelligence software. The curriculum covers database structure principles, column transformations, and calculated metrics design. Training incorporates real-world oil and gas scenarios, such as tracking rig utilization rates and field maintenance costs.
Phase 3: Applied Mentoring and Capstone Execution
Learners apply their skills to real company datasets during guided capstone projects. Internal subject matter experts and external mentors provide technical guidance, helping developers debug complex analytical expressions and optimize dashboard layouts. This phase bridges theoretical instruction and real-world corporate execution.
Phase 4: Operational Integration and Governance
The organization establishes business intelligence governance frameworks, publishing standards, and security protocols. Department heads integrate newly developed dashboards into weekly operational reviews. L&D teams evaluate performance improvements, tracking metric adoption and report delivery speed across operational units.
What Key Components Are Included in an Effective Dashboard Framework?
An effective dashboard framework includes clean data pipelines, optimized data schemas, dynamic metric logic, interactive navigation elements, and purposeful visual layouts. These elements ensure accurate metrics processing, fast query response times, and clear operational insight for decision-makers.
1. Data Transformation Engine
The baseline layer handles connection protocols and data ingestion workflows. Advanced ETL processes clean inconsistent field data, unpivot complex operational tables, and enforce uniform data types across enterprise systems.
2. Analytical Data Model
A high-performing dashboard relies on clean database architecture, such as star schemas. The data model isolates business transaction facts—like daily production barrels or equipment maintenance expenses—from dimension lookup tables containing dates, well locations, and asset types.
3. Dynamic Calculation Measures
Custom code measures handle complex business calculations across changing filter contexts. Time intelligence calculations compute year-to-date output, rolling 30-day averages, and budget-to-actual cost variances on demand without inflating file sizes.
4. Interactive User Interface
Visual layouts match user navigation preferences and executive decision workflows. Slicers allow users to filter reports by region, field operator, or asset class, while drill-through capabilities let managers inspect individual well performance from high-level summaries.
5. Performance Optimization Layer
Large enterprise datasets require query performance optimization to maintain fast refresh rates. Developers optimize data models by removing unneeded columns, aggregating transactional records, and replacing heavy calculated columns with efficient measures.
How Do Dashboards Solve Critical Operational and Financial Challenges?
Dashboards eliminate manual reporting errors, reduce analytical overhead, and prevent expensive production delays. By presenting operational metrics clearly, these visual systems help corporate leaders reallocate capital quickly and maintain low lease operating expenses.
Manual data processing creates significant operational risk in capital-intensive sectors like energy production. When asset managers rely on disconnected spreadsheets, identifying well underperformance can take weeks, leading to missed revenue targets and unexpected downtime. Visual analytics systems consolidate operational datasets, giving decision-makers early visibility into equipment failures and cost overruns.
For technical details on structuring raw field data and configuring star schema relationships, explore our guide on How to Model Production and Cost Data for Effective Power BI Dashboards.
Corporate leaders use dynamic dashboards to solve common organizational challenges:
Capital Misallocation: Real-time variance tracking flags unprofitable assets early, allowing executives to redirect capital toward high-yield extraction activities.
Reporting Inconsistencies: Centralized business logic ensures finance, engineering, and field operations use identical production definitions and financial KPIs.
Information Latency: Automated refresh schedules deliver daily field updates, replacing outdated weekly or monthly status meetings.
High Lease Operating Expenses: Granular cost reporting isolates rising expenditures in power consumption, chemical treatments, and field logistics across operating sites.
When technical professionals complete targeted training programs like the Power BI for Production & Cost Dashboards: Modelling Training Course, they gain the skills required to convert complex enterprise data into decision-ready assets.
What Specific Benefits Do Dashboards Deliver to Energy Organisations and Teams?
Dashboards increase workforce productivity, lower operational expenditures, and strengthen executive decision-making. Standardised visual reports boost operational efficiency by 25% and reduce monthly financial closing cycles by 5 working days.
Organisations that invest in analytics capability build a lasting competitive advantage. Standardised reporting frameworks simplify cross-departmental reviews, ensuring operations and finance teams evaluate performance using consistent data. Reducing manual reporting tasks saves employees 10 to 15 hours every week, giving technical staff more time for high-value optimization projects.
Organisational Impact
Higher Operating Margins: Continuous monitoring keeps lease operating expenses within strict operational targets across mature and offshore fields.
Better Risk Mitigation: Automated variance alerts highlight pipeline pressure changes, equipment temperature anomalies, and budget overruns before failures happen.
Improved Governance: Centralised reporting hubs ensure strict compliance with enterprise data security guidelines and industry audit requirements.
Team-Level Impact
Stronger Collaboration: Technical specialists, asset managers, and financial analysts work from shared, verified data dashboards.
Faster Decision-Making: Engineering teams resolve technical issues quickly without waiting for ad-hoc financial reporting runs.
Professional Growth: Acquiring advanced analytics skills builds long-term capability and strengthens internal leadership pipelines.
Where Are Production and Cost Dashboards Applied Across Corporate Departments?
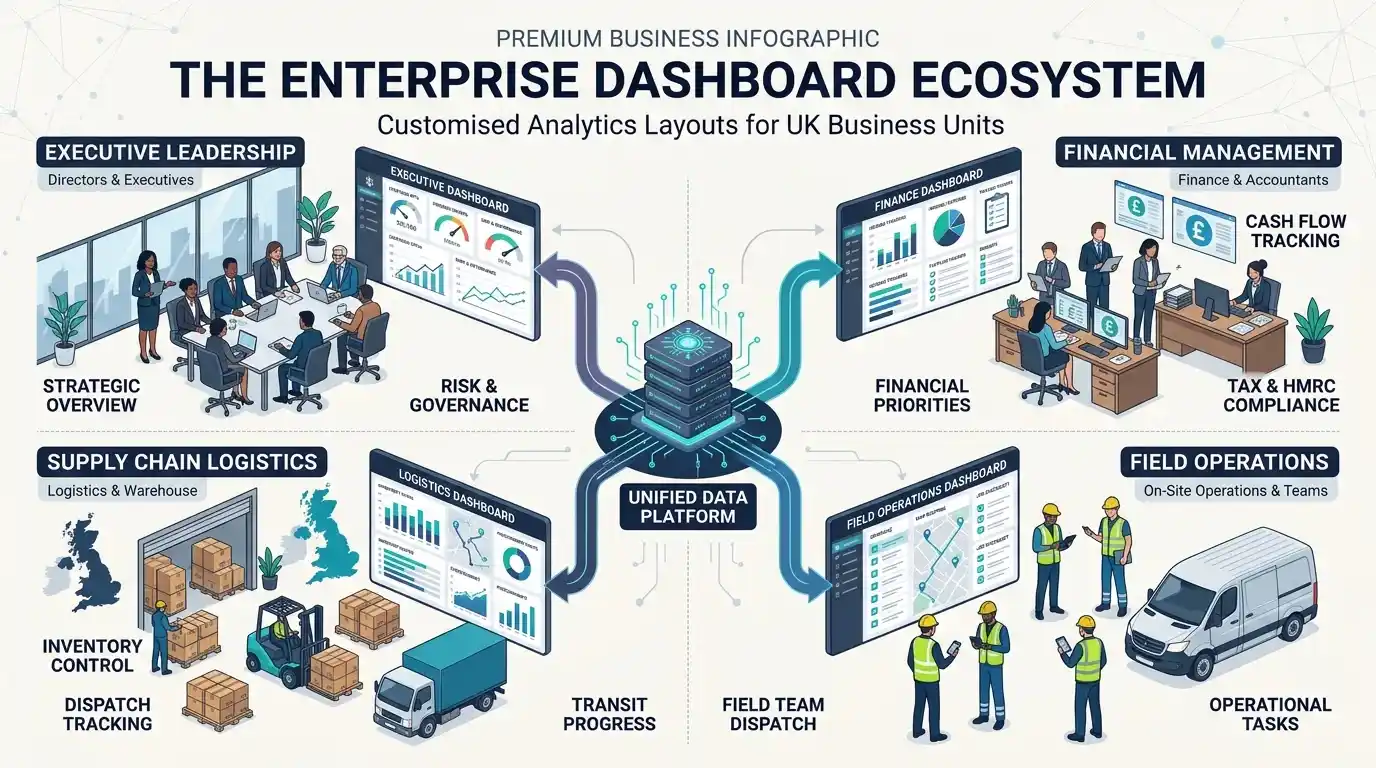
Dashboards support diverse business units, including field operations, financial management, supply chain logistics, and executive leadership. Every department uses customized analytics layouts to address specific operational tasks and financial priorities.
Upstream Field Operations
Asset teams use operational dashboards to monitor daily extraction rates, artificial lift performance, and unplanned downtime across well networks. Drilling engineers track rate of penetration (ROP), mud hydraulics, and bit wear metrics to keep active rig operations on schedule.
Finance and Corporate Accounting
Financial controllers track operating costs per barrel, capital expenditure variances, and joint venture billing allocations. Centralized dashboards connect field operational volumes directly to general ledger accounts, clarifying profit margins across regions.
Supply Chain and Field Logistics
Logistics teams manage vendor performance, chemical inventories, and heavy equipment deployment schedules. Dashboard analytics highlight supply chain bottlenecks, helping procurement managers renegotiate transportation rates and reduce warehouse holding costs.
Executive Leadership and Board Governance
C-suite executives review high-level portfolio performance, strategic growth projects, and health, safety, and environment (HSE) metrics. Portfolio dashboards synthesize regional operations into concise executive views, highlighting risk factors that require immediate board attention.
What Are the Misconceptions and Failures in Corporate Dashboard Projects?
Dashboard projects fail when companies buy software tools without training their workforce, build overly complex visual layouts, or neglect backend data modelling. Sustainable value requires investment in technical skills, clear data governance, and user-centric dashboard design.
A common corporate error is treating analytics adoption purely as an IT procurement task rather than a workforce skill transformation. Buying software licenses without providing structured employee training produces cluttered, slow, and inaccurate dashboards that staff quickly abandon. Effective enterprise adoption balances technology investments with comprehensive workforce development programs.
Misconception 1: Software Automation Replaces Skill Development
Organisations often assume modern analytics platforms generate insights automatically. Without formal training in data modeling, staff build improper relationships and incorrect measures, leading to bad business decisions based on flawed metrics.
Misconception 2: More Visual Elements Create Better Reports
Inexperienced developers often pack dozens of charts onto a single dashboard screen. Overcrowded reports confuse users, hide critical information, and slow down page loading times. Effective dashboards focus on key metrics and clear visual hierarchy.
Misconception 3: Backend Data Architecture Is Optional
Building reports directly from raw, unorganized flat tables causes slow queries and high memory consumption. Skipping proper schema design forces software to calculate metrics inefficiently, frustrating business users during time-sensitive reviews.
Misconception 4: One Dashboard Layout Fits Every Stakeholder
Designing a single catch-all report for field technicians, financial managers, and executives pleases nobody. Field operators require real-time granular detail, whereas executives require concise strategic summaries. Development teams must build tailored visual reports for each user role.
Frequently Asked Questions
What is Oil & Gas Petroleum Digital Finance & Automation training?
Oil & Gas Petroleum Digital Finance & Automation training equips financial analysts, accounting teams, and operational managers with the skills to digitise financial workflows across energy enterprises. Delivered by the Institute For Oil & Gas Training, this professional development program covers automated ledger reconciliation, lease operating expense tracking, and real-time financial reporting integration. Participants learn how to replace legacy manual spreadsheets with modern business intelligence platforms and automated data pipelines.
How does financial automation improve decision making in the oil and gas sector?
Automating petroleum financial workflows eliminates manual data entry errors, accelerates monthly closing cycles, and provides real-time visibility into joint venture accounting and capital expenditures. Through Oil & Gas Petroleum Digital Finance & Automation courses at the Institute For Oil & Gas Training, professionals build unified data models that link field production metrics directly with general ledger accounts. This integrated approach allows management to analyze lifting costs per barrel instantly and reallocate capital to high-yield extraction assets.
Who should enrol in a petroleum digital finance and automation course?
This practical workforce development program targets financial controllers, petroleum accountants, joint venture auditors, L&D managers, and operational decision-makers seeking workforce transformation in the energy industry. The Institute For Oil & Gas Training designs its Oil & Gas Petroleum Digital Finance & Automation curriculum to address specific technical skill gaps in energy accounting and data modeling. It provides immediate value for both individual professionals aiming for career advancement and corporate teams scaling enterprise analytics.
What technical tools and concepts are taught in petroleum digital finance programs?
Participants learn to implement automated ETL workflows using Power Query, build resilient star schema relational models, and write custom DAX measures for financial variance analytics. The Oil & Gas Petroleum Digital Finance & Automation training provided by the Institute For Oil & Gas Training incorporates hands-on exercises with enterprise ERP systems, SCADA data feeds, and interactive Power BI dashboards. Learners gain practical expertise in setting up automated data refresh schedules and implementing secure role-based access for executive financial reporting.
What business outcomes do organisations achieve through digital finance automation?
Organisations deploying these capabilities typically reduce financial reporting latency by up to 80% and shorten monthly reconciliation cycles by several working days. By training workforce personnel through the Institute For Oil & Gas Training in Oil & Gas Petroleum Digital Finance & Automation, companies establish standardized financial metrics across exploration, production, and refining divisions. This systemic efficiency lowers operating overhead, improves regulatory compliance, and maximizes cash flow transparency across international asset portfolios.
Related training courses
Digital Transformation in Petroleum Finance: AI & RPA Training Course
- Specialisation
- Oil & Gas Petroleum Digital Finance & Automation
- Duration
- 5 days · 15 CPD hours
Power BI for Production & Cost Dashboards: Modelling Training Course
- Specialisation
- Oil & Gas Petroleum Digital Finance & Automation
- Duration
- 5 days · 15 CPD hours
Automation of JV & PSC Reporting: Process Candidates Training Course
- Specialisation
- Oil & Gas Petroleum Digital Finance & Automation
- Duration
- 5 days · 15 CPD hours
More articles
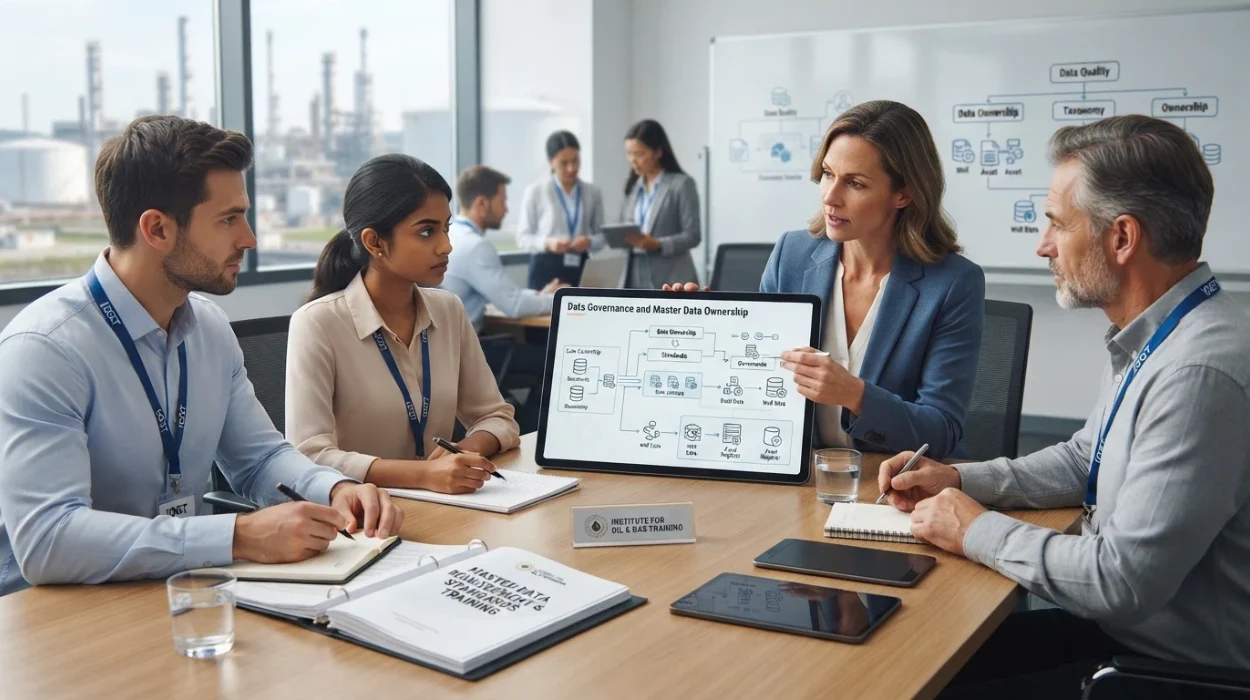
Data Governance and Master Data Ownership and Standards Training by Institute For Oil & Gas Training
Evaluate the Data Governance & Master Data Ownership & Standards Training Course syllabus, delivery, outcomes, and enrollment requirements.
Read article →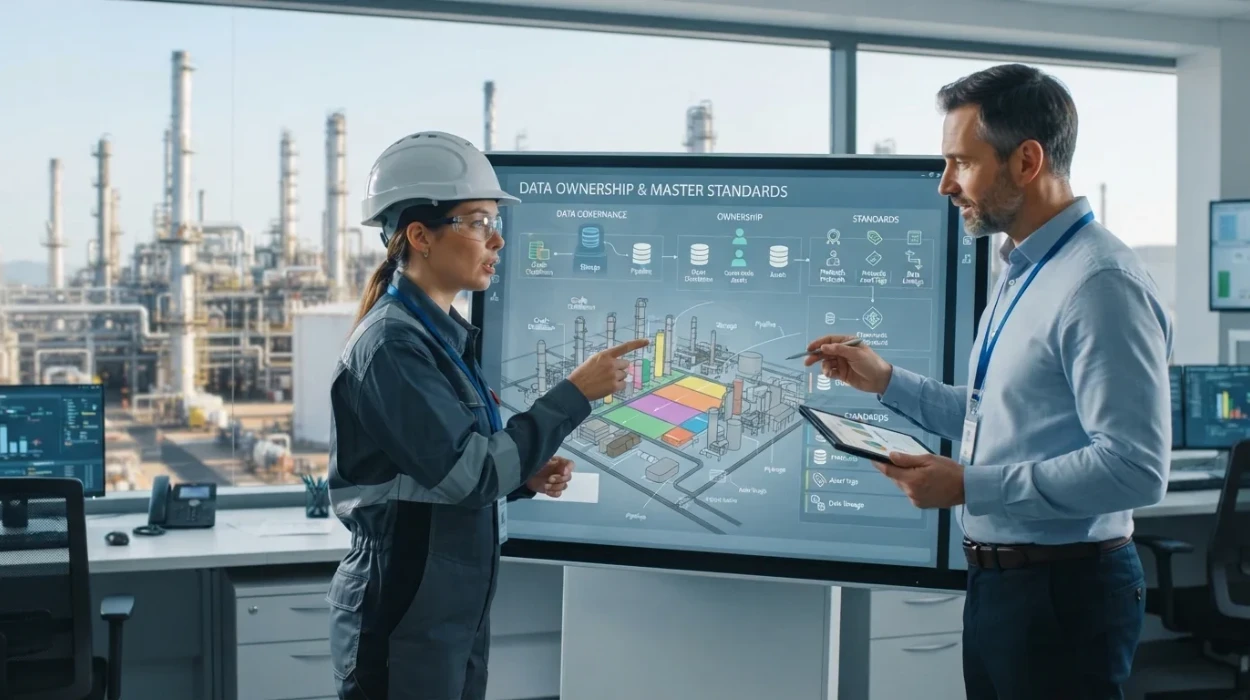
How to Define Data Ownership and Master Data Standards for Petroleum Operations
Learn how petroleum operations define data ownership, establish master data management standards, and improve data governance frameworks.
Read article →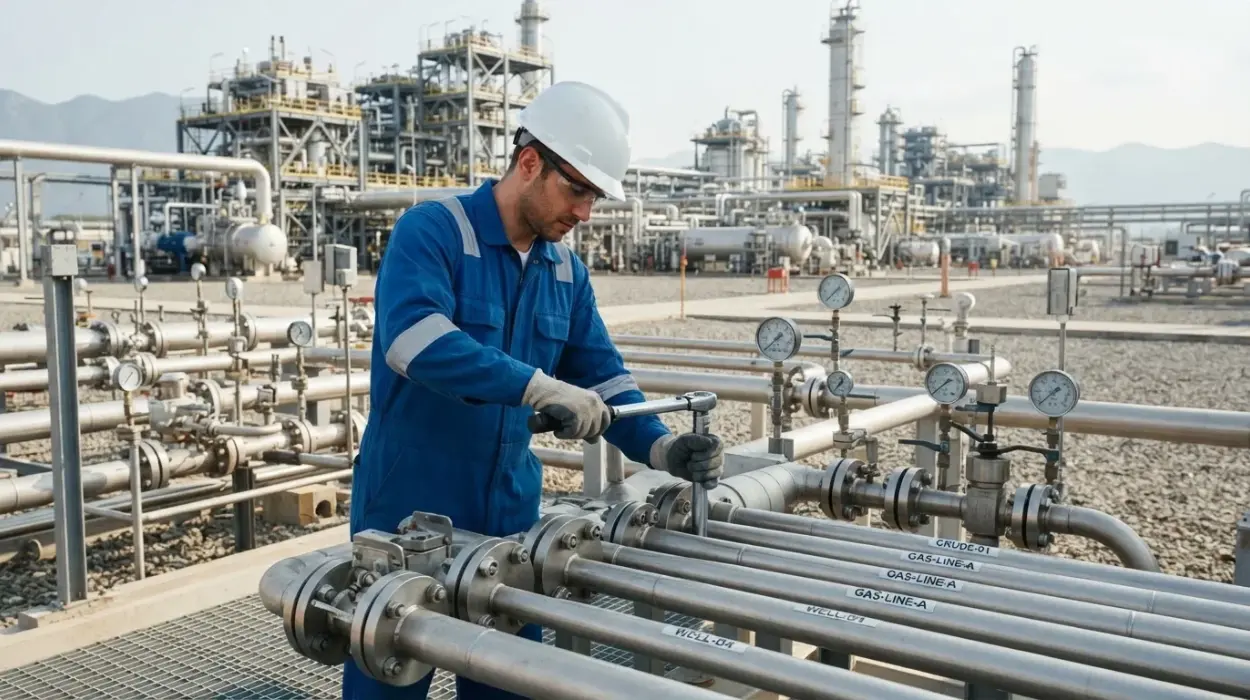
Why Data Governance and Master Data Standards Matter in Oil and Gas
Learn why data governance and master data standards transform petroleum operations, resolve enterprise risk, and drive ROI across global energy assets.
Read article →