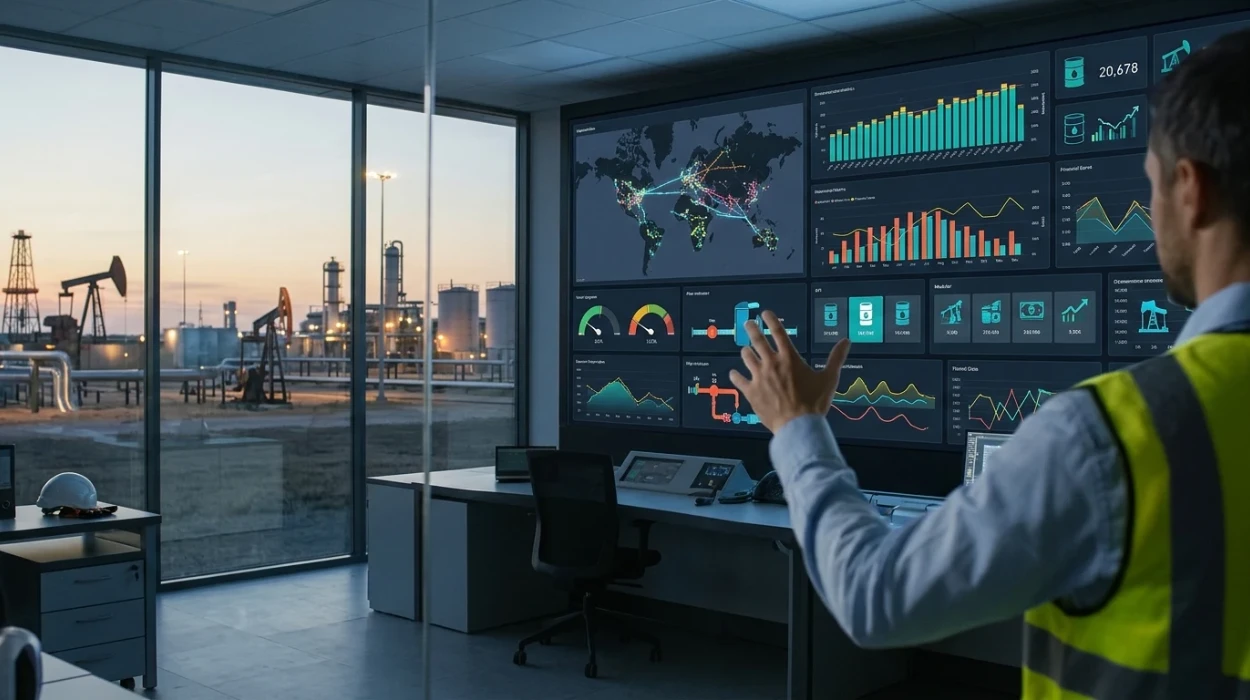
An effective Power BI dashboard for oil and gas production and costs is an enterprise analytics solution that unifies operational metrics, financial data, and field updates into real-time visual interfaces to drive workforce efficiency and strategic decision-making.
In corporate environments, raw operational data remains trapped inside isolated departments such as field operations, supply chain logistics, and accounting. An effective dashboard integrates these disparate data streams into a single source of truth. This centralized structure enables key decision-makers, such as operations directors and asset managers, to monitor field performance without manually compiling spreadsheets.
Organizations use these data tools to resolve critical employee skill gaps in data literacy and business intelligence. Modern workplaces require professionals to interpret complex datasets, translate field metrics into financial outcomes, and present actionable insights to senior leadership. Implementing standardized reporting frameworks equips business units with consistent measurement criteria.
An effective power bi dashboard for oil and gas production and costs combines real-time data ingestion with structured data modeling. The dashboard translates raw barrel counts, equipment uptime, and operational expenditures into clear performance indicators. Teams gain immediate visibility into operational bottlenecks, budget overruns, and downtime causes, transforming reactive troubleshooting into proactive asset management.
How does production performance tracking work in oil and gas corporate environments?
Production performance tracking works by automating field data collection, processing metrics through structured analytical models, and publishing interactive visual reports that streamline daily operations across exploration, production, and refining business units.
Corporate implementation follows a structured analytical pipeline. Data moves from wellhead sensors, SCADA systems, and enterprise resource planning software directly into centralized data warehouses. Analytical models process this input using dashboard design principles to present real-time operational status.
Enterprise learning programs structure this analytical process through defined corporate stages:
Data Ingestion and Cleansing: Connecting raw field inputs to cloud repositories through automated gateway configuration.
Data Modeling: Establishing relational data schema to connect volume data with financial accounting tables.
KPI Visualisation: Structuring executive views that display production volume tracking against monthly target thresholds.
Security Management: Applying row level security to limit access based on user role, geographical asset, or operational authority.
Deployment: Distribution of validated reports through secure workspace and app deployment channels.
When enterprise teams lack formal training in data architecture, dashboards experience severe performance lag, incorrect metric calculation, and security vulnerabilities. Structured learning formats, including intensive workshops and hands-on simulations, build technical competence across technical teams.
Employees master data transformation techniques, DAX language calculations, and user-experience design. This technical mastery ensures that published reports load in under 3 seconds, scale across thousands of concurrent corporate users, and maintain absolute precision across all financial calculations.
What key components make up an upstream operational dashboard?
Key components include customized DAX measure calculations, dynamic KPI cards, time-series trend line visuals, comparative variance matrices, role-based security architectures, and automated gateway data connection protocols.
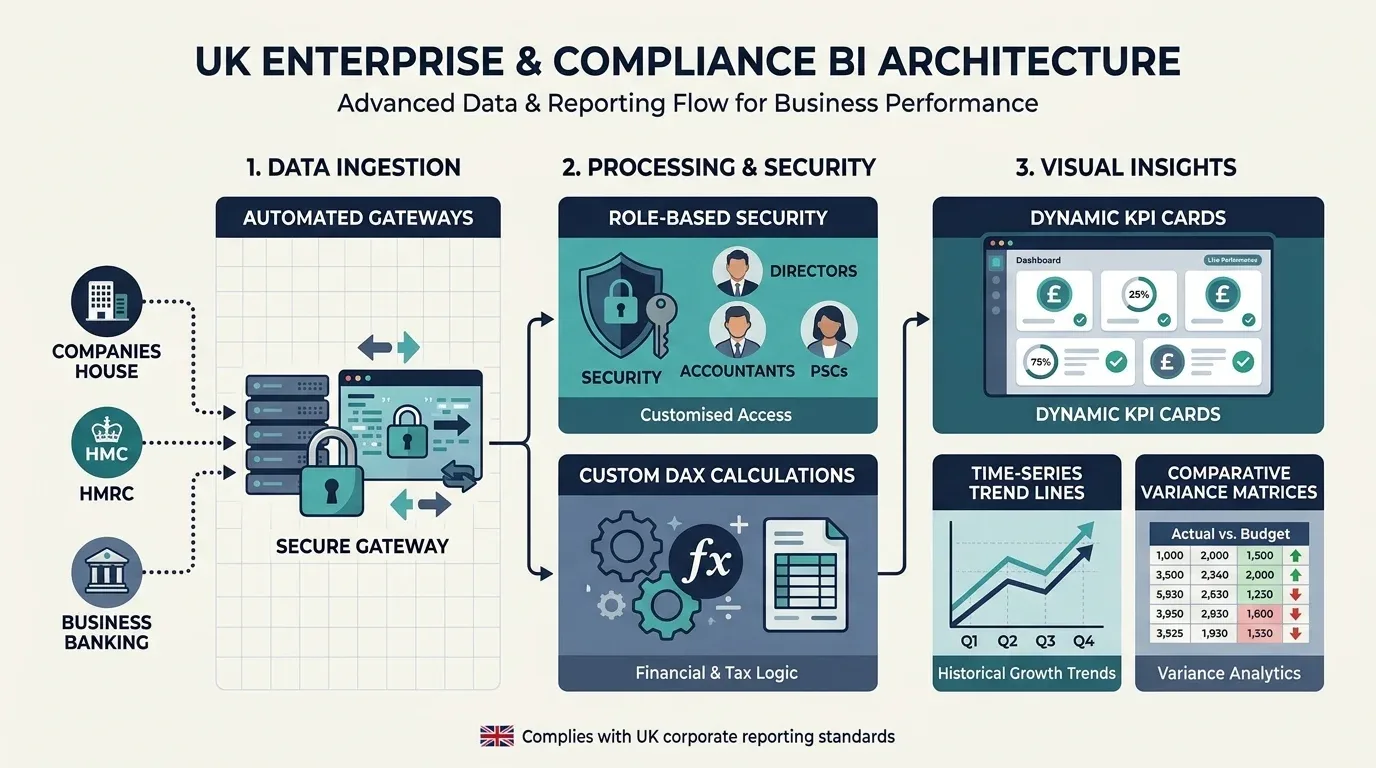
Comprehensive reporting solutions rely on specific visual and architectural elements:
Component Category | Technical Element | Operational Function |
Financial Metrics | Cost per barrel dashboard visual | Calculates immediate operating expense per volume unit produced across active wells. |
Operational Tracking | Production volume tracking chart | Displays daily, weekly, and monthly hydrocarbon extraction volumes against targets. |
Financial Control | Budget versus actual visuals | Highlights expenditure variances across drilling, completion, and maintenance activities. |
System Security | Row level security rules | Restricts sensitive cost data based on organizational hierarchy and regional permissions. |
Data Architecture | Scheduled data refresh settings | Coordinates automated data updates 8 times daily to ensure reporting currency. |
Distribution | Workspace and app deployment | Package reports securely for desktop, mobile, and partner facing reporting access. |
Integrating these components requires balanced expertise in business domain knowledge and data analytics. A standard production interface features top-level visual cards detailing daily barrel outputs, active rig counts, and total operating expenses.
Detailed sub-pages break down cost drivers into capital expenditure and operational expenditure. Interactive slicers allow department managers to filter performance by geological basin, production facility, or individual extraction site.
Enterprise training ensures that staff build these visuals following cognitive design principles. Poorly configured dashboards clutter interfaces with unnecessary visual elements, obscuring critical field alerts. Structured corporate instruction trains engineers and analysts to prioritize key performance indicators, use consistent color palettes for variance tracking, and eliminate visual distractions.
How do organizations implement Power BI training to resolve employee skill gaps?
Organizations implement Power BI training by conducting baseline skill assessments, delivering hands-on case-based learning workshops, applying real-world data simulations, and evaluating post-training productivity improvements across operational teams.
Enterprise skill gap resolution requires a systematic capability development strategy. Companies begin by auditing current employee competencies across operations, finance, and engineering divisions. This diagnostic identifies specific gaps in data modeling, visual design, and DAX expression writing.
Structured corporate development incorporates tailored learning methodologies:
Baseline Skill Audits: Evaluating team capabilities using standardized technical questionnaires and practical analytical exercises.
Interactive Workshops: Delivering 16 to 24 hours of live instruction focused on industry-specific data sets.
Real-World Scenario Simulations: Tasking learners to resolve real-world operational challenges, such as tracking non-productive downtime or mapping production decline curves.
Competency Assessments: Testing individual ability to construct functional reports, configure scheduled data refresh schedules, and establish secure data connections.
Post-Training Impact Evaluation: Measuring ongoing workforce productivity improvements, report adoption rates, and timesaving metrics over 30, 60, and 90 days.
Hybrid learning models combine self-paced digital modules with intensive instructor-led sessions. This format minimizes operational disruption while delivering practical skill acquisition. Professionals apply learned techniques directly to active corporate data environments during guided lab exercises.
When organizations transition from basic spreadsheet reporting to enterprise analytics, teams must understand how design principles dictate reporting efficiency. Mastering structured interface design, visual hierarchy, and performance tuning ensures business intelligence assets remain scalable and user-friendly. Reviewing comprehensive design strategies inside How to Design Power BI Dashboards for Production Performance and Cost Analysis gives technical teams the structural blueprints necessary to convert complex field calculations into clear executive reports.
What measurable outcomes do effective dashboards produce for energy companies?
Effective dashboards produce measurable outcomes including a 30% reduction in manual reporting time, a 15% improvement in operating cost visibility, and a 25% increase in cross-departmental decision speed.
Standardizing business intelligence solutions across corporate functions drives clear financial and operational returns. Automated data pipelines remove manual copy-paste workflows, freeing technical analysts to focus on root-cause analysis and predictive optimization.
Corporate investments in structured business intelligence capability yield specific organizational metrics:
Reduced Operational Overhead: Replacing manual spreadsheet compilation saves analysts up to 12 hours per week per employee.
Enhanced Cost Control: Granular visibility into line-item expenses reduces unnecessary operational expenditures by 5% to 8% annually across active assets.
Accelerated Incident Response: Real-time variance alerts enable field managers to identify and correct equipment failures within 2 hours instead of 48 hours.
Improved Compliance and Governance: Standardized row level security rules eliminate unauthorized data exposure, achieving 100% compliance with corporate data protection standards.
Streamlined Partner Reporting: Automated partner facing reporting solutions reduce joint-venture audit prep times from 3 weeks to 2 days.
Sustained performance improvement requires ongoing workforce instruction. To ensure these systems deliver maximum operational value, professionals enroll in specialized technical programs such as the Power BI for Production & Cost Dashboards: Design Training Course. Professional development transforms business intelligence software from simple visual displays into an active engine for corporate performance improvement, career growth, and workforce transformation.
What common mistakes lead to ineffective corporate reporting tools?
Common mistakes include building over-complicated visual models without governance, ignoring row-level security, omitting performance optimization, and delivering generic training programs detached from industry-specific operational workflows.
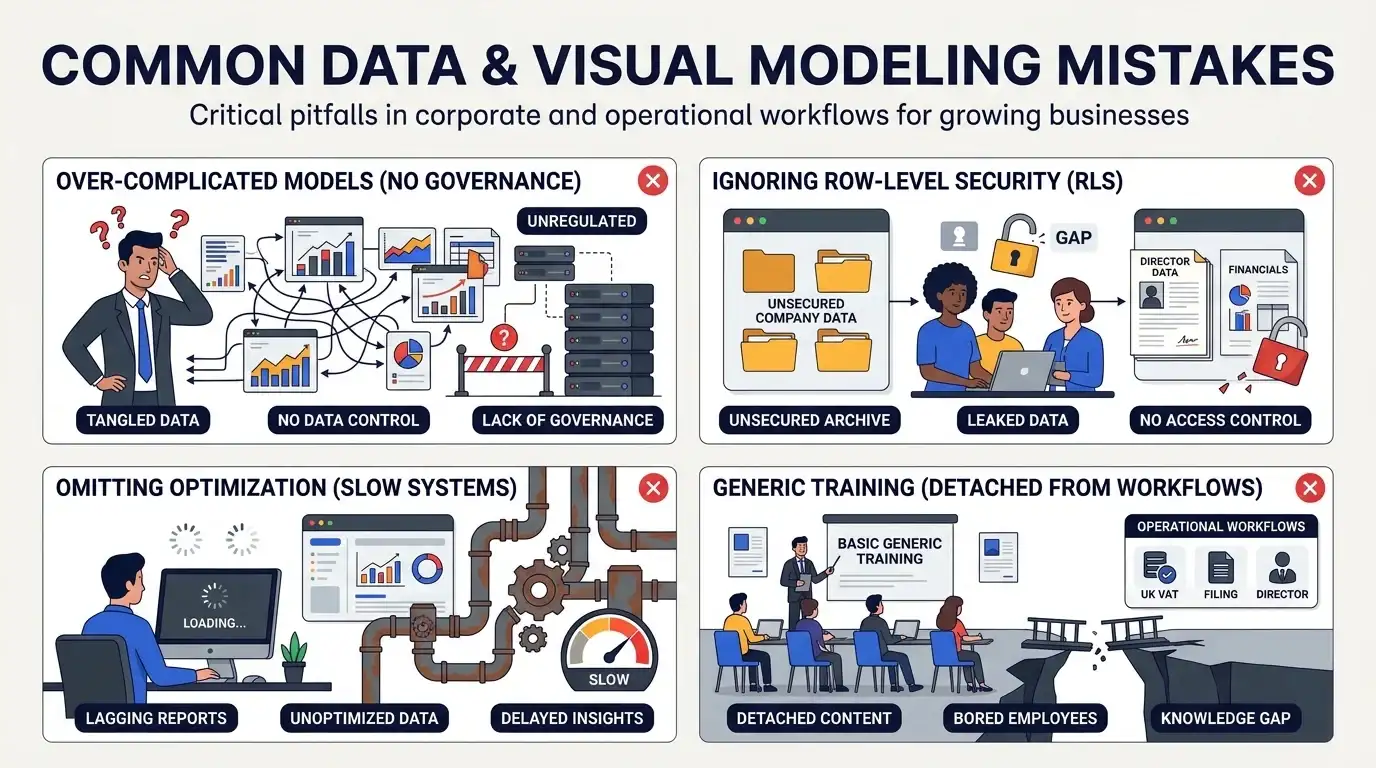
Corporate reporting initiatives fail when organizations treat software deployment as a simple IT installation rather than a workforce capability transformation. Installing tools without training employees leads to fragmented report builds, inconsistent metric definitions, and low platform adoption.
Major implementation errors fall into four primary categories:
Lack of Industry-Specific Context: Generic software courses teach basic chart creation but fail to cover specialized oil and gas calculations such as boe (barrels of oil equivalent), decline curve analysis, or joint-interest billing.
Unoptimized DAX and Data Architecture: Inefficient data models force full-dataset scans on every user click, causing visual render times to exceed 15 seconds and resulting in user abandonment.
Neglecting Data Governance and Gateway Setup: Failing to properly configure gateway connections and row level security exposes confidential financial metrics to unauthorized internal or external parties.
Overcrowded Visual Layouts: Cramming dozens of unorganized visual elements onto a single page obscures critical trends, leading to decision paralysis among executive leadership.
Overcoming these errors requires practical, outcome-based professional development aligned with real-world corporate needs. Organization-wide alignment occurs when training programs combine technical data architecture with practical domain application.
Which departments benefit most from standardized analytics training?
Operations, finance, supply chain, asset management, and executive leadership departments benefit most from standardized analytics training through synchronized reporting, improved data accuracy, and shared performance visibility.
Standardized business intelligence capability breaks down operational silos across modern energy enterprises:
Cross-departmental impact spans multiple functional units:
Operations and Engineering Teams
Engineers and field superintendents gain real-time visibility into production volume tracking, artificial lift efficiency, and well downtime causes. Automated reporting eliminates late afternoon manual entry, enabling field staff to focus on optimizing extraction output.
Finance and Accounting Divisions
Financial analysts merge field data with ledger records to automate cost per barrel dashboard calculations. Teams track budget versus actual visuals continuously, preventing cost overruns before monthly financial books close.
Supply Chain and Logistics
Procurement specialists track vendor performance, equipment delivery timelines, and chemical consumption rates across drilling sites. Visual inventory tracking prevents supply shortages that cause costly rig delays.
Executive Leadership and Asset Managers
Senior leaders access consolidated dashboards through secure mobile devices. Unified executive views present key performance indicators clearly, allowing board members and directors to allocate capital dynamically across regional assets.
Frequently Asked Questions
What is Oil & Gas Petroleum Digital Finance & Automation?
Oil & Gas Petroleum Digital Finance & Automation refers to the integration of advanced digital technologies—such as robotic process automation (RPA), enterprise resource planning (ERP) analytics, and artificial intelligence—into energy sector accounting and financial operations. Training programs from the Institute For Oil & Gas Training equip energy professionals with the technical skill set required to automate complex joint-venture accounting, streamline field cost tracking, and modernise financial workflows. By implementing Oil & Gas Petroleum Digital Finance & Automation, petroleum companies replace manual spreadsheet dependencies with automated reporting architecture that ensures real-time operational cost management.
How does financial automation benefit petroleum companies?
Financial automation streamlines high-volume energy accounting processes, including joint-interest billing, production royalty calculations, and regulatory compliance reporting. Modern solutions delivered by the Institute For Oil & Gas Training reduce manual processing errors, cut financial closing times, and enable real-time cost-per-barrel tracking. Adopting Oil & Gas Petroleum Digital Finance & Automation enhances data governance, ensures audit readiness, and delivers dynamic financial visibility across exploration and production assets.
What core skills are covered in digital finance training for the energy sector?
Comprehensive digital finance curricula focus on financial data modeling, automated invoice processing, dynamic variance analytics, and API data integration between field SCADA systems and financial ledgers. Participants learning through Institute For Oil & Gas Training develop practical proficiency in building cloud-based analytics dashboards and configuring business process automation rules. Mastering Oil & Gas Petroleum Digital Finance & Automation helps finance teams interpret operational datasets efficiently and translate field metrics into actionable financial insights.
Why is digital finance transformation critical for upstream oil and gas operations?
Upstream operations involve complex joint ventures, volatile commodity pricing, and capital-intensive exploration projects that require precise financial management. Oil & Gas Petroleum Digital Finance & Automation eliminates reporting latency between remote drilling sites and corporate finance departments by establishing automated data connections. Professionals trained by the Institute For Oil & Gas Training leverage automated forecasting and variance tracking tools to protect operating margins and optimize capital allocation across hydrocarbon assets.
Who should undertake training in petroleum financial automation?
This specialized skill development is designed for financial controllers, joint-venture accountants, petroleum economists, commercial analysts, and finance managers in energy corporations. Programs provided by the Institute For Oil & Gas Training cater to both finance teams adopting modern business intelligence systems and IT professionals implementing enterprise automation architectures. Gaining expertise in Oil & Gas Petroleum Digital Finance & Automation prepares energy leaders to drive operational efficiency and workforce digital transformation across global energy markets.
Related training courses
ERP Systems for Oil & Gas: Access Controls Training Course
- Specialisation
- Oil & Gas Petroleum Digital Finance & Automation
- Duration
- 5 days · 13 CPD hours
Digital Transformation in Petroleum Finance: AI & RPA Training Course
- Specialisation
- Oil & Gas Petroleum Digital Finance & Automation
- Duration
- 5 days · 15 CPD hours
Power BI for Production & Cost Dashboards: Modelling Training Course
- Specialisation
- Oil & Gas Petroleum Digital Finance & Automation
- Duration
- 5 days · 15 CPD hours
More articles
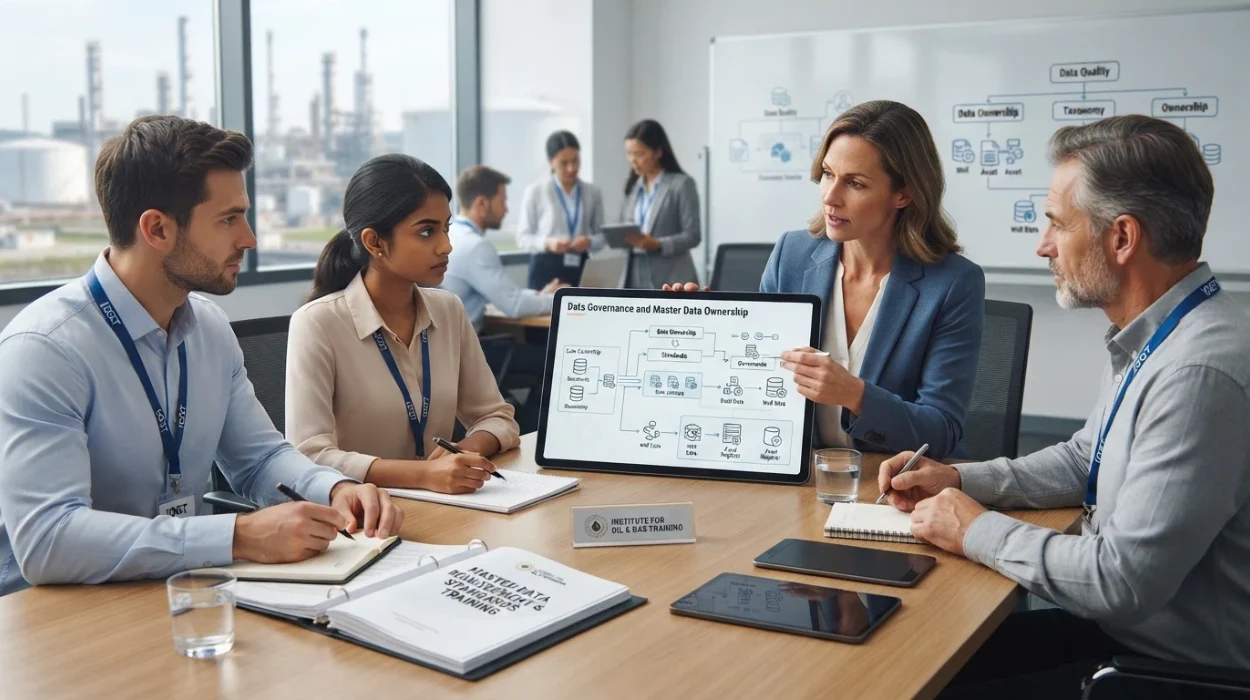
Data Governance and Master Data Ownership and Standards Training by Institute For Oil & Gas Training
Evaluate the Data Governance & Master Data Ownership & Standards Training Course syllabus, delivery, outcomes, and enrollment requirements.
Read article →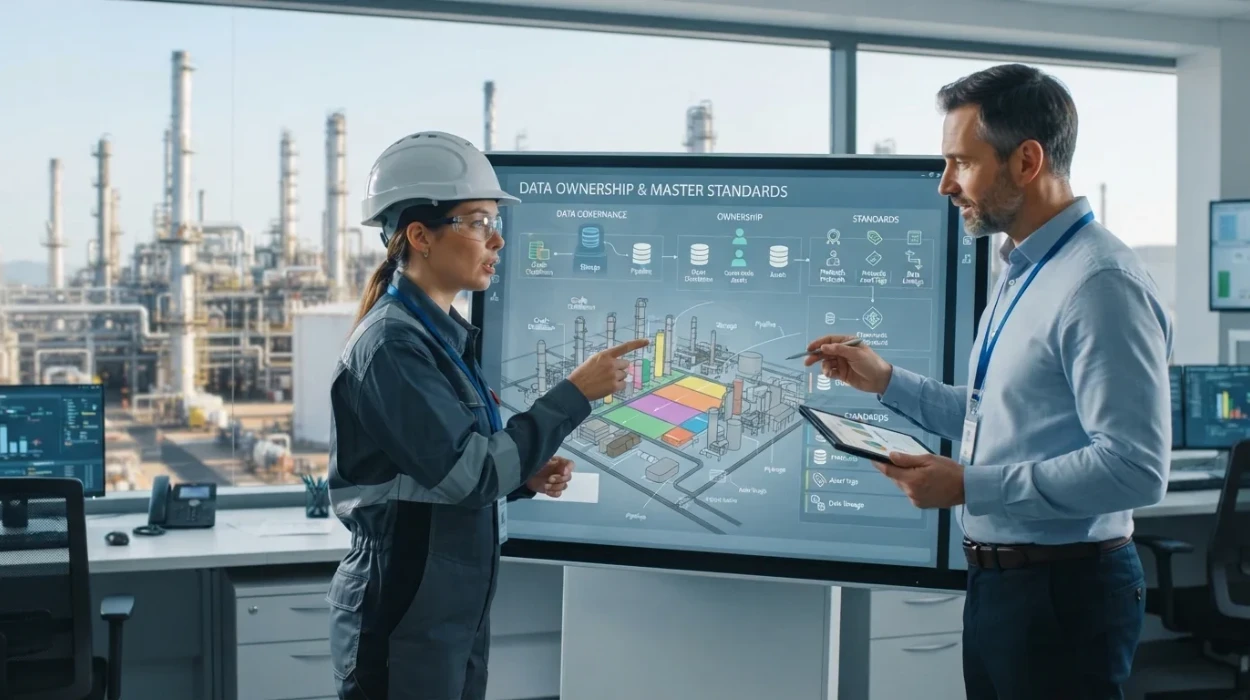
How to Define Data Ownership and Master Data Standards for Petroleum Operations
Learn how petroleum operations define data ownership, establish master data management standards, and improve data governance frameworks.
Read article →
Why Data Governance and Master Data Standards Matter in Oil and Gas
Learn why data governance and master data standards transform petroleum operations, resolve enterprise risk, and drive ROI across global energy assets.
Read article →