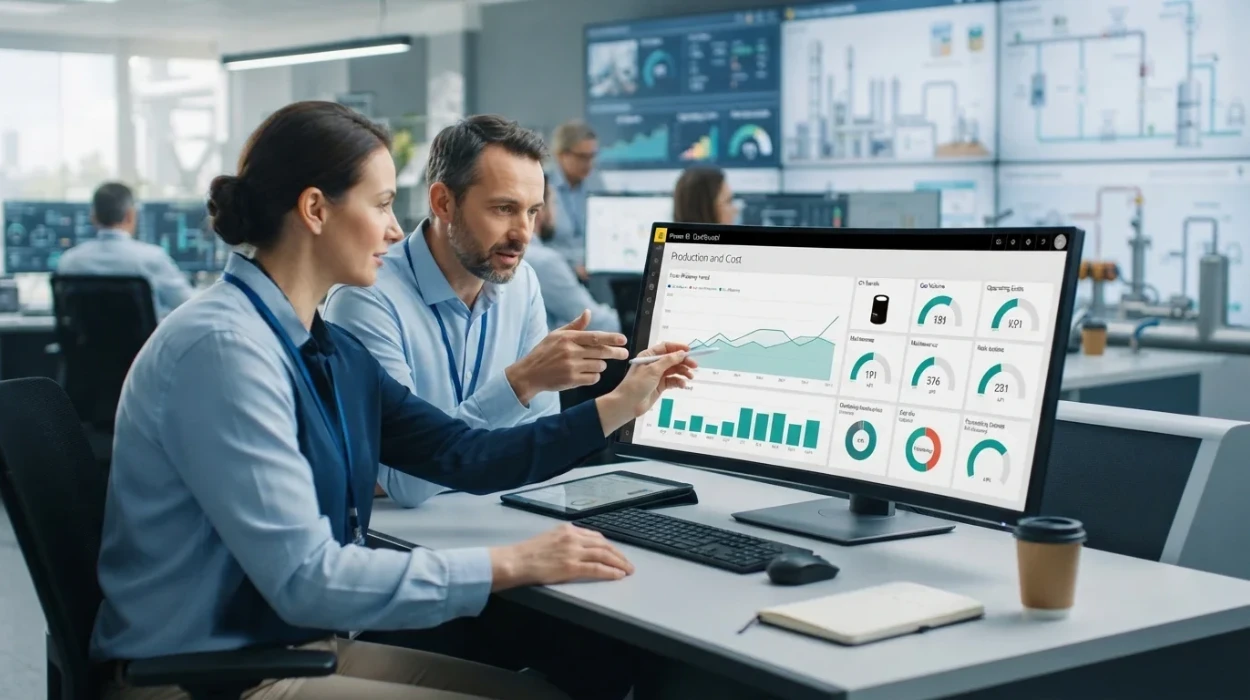
The energy sector operates under tight operational margins, requiring real-time visibility into field volume metrics, operating expenditure, and capital allocation. Traditional spreadsheet workflows create data latency, manual processing errors, and limited governance across multi-asset portfolios. Without structured dashboard engineering standards, technical teams fail to translate raw supervisory control and data acquisition feeds or ERP transactional records into strategic reporting models. This skill gap slows executive decision-making, increases reporting overhead, and restricts cross-departmental financial alignment.
The Power BI for Production & Cost Dashboards Design Training Course provided by the Institute For Oil & Gas Training bridges this technical gap by establishing precise data modeling, visualization, and architecture standards. Operational teams frequently struggle with fragmented data, as detailed in our analysis of what makes an effective Power BI dashboard for oil and gas production and costs. This training establishes a robust engineering framework that converts unstructured field logs into automated executive decision tools.
What Is the Course and What Workplace Problem Does It Solve?
This course is a technical training program designed to standardise field data intake, cost tracking models, and executive visual analytics. It resolves data fragmentation, manual reconciliation delays, and operational reporting inconsistencies across oil and gas production operations.
Upstream, midstream, and downstream operations generate massive volumes of disparate operational data across varied software environments. Petroleum engineers, asset managers, and financial analysts routinely expend significant manual effort consolidating daily production logs, wellhead pressures, lease operating expenses, and joint interest billings into static spreadsheets. This reliance on manual reporting introduces high error risks, obscures cost variances, and prevents real-time variance analysis across operating units.
The lack of standard dashboard design principles causes fragmented reporting systems where different departments present conflicting operational metrics. HR development heads and operational leads observe lower productivity when technical professionals lack skills in advanced business intelligence tooling. Technical teams often miss advanced modeling principles, leading to slow query execution, broken data pipelines, and poor report adoption among field managers.
The Institute For Oil & Gas Training developed this curriculum to address these specific technical bottlenecks. By framing reporting as a standardized engineering process, the course transforms how upstream assets log, aggregate, and visualize operational metrics. Participants shift from reactive manual spreadsheet compilation to automated reporting architectures. This shift allows operational leaders to focus on variance mitigation and asset optimization instead of data cleansing and manual report distribution.
Why Is the Curriculum Structured for Production and Cost Analysis?
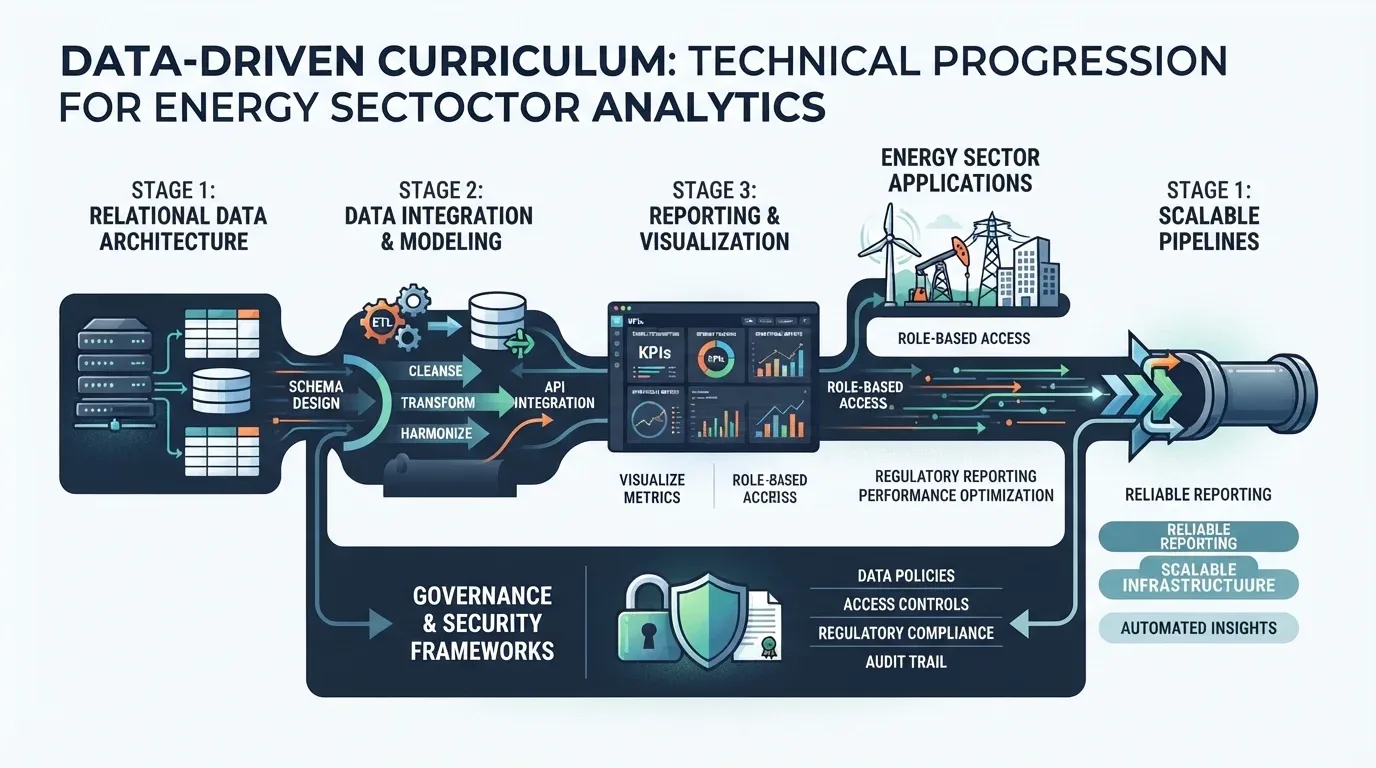
The curriculum follows a technical progression from relational data architecture to governance and security frameworks. This structure ensures participants build scalable reporting pipelines aligned directly with energy sector operational metrics and financial tracking frameworks.
Building reporting systems for energy assets requires a clear understanding of production engineering metrics and operational accounting standards. The syllabus avoids generic data visualization theory, focusing entirely on upstream and midstream operational scenarios. Participants learn how to handle complex data relationships, such as multi-well production hierarchies, variable lease operating expenses, and fluctuating commodity pricing models.
The course framework follows a step-by-step technical progression to ensure deep skill acquisition. Participants move from fundamental database schema design to advanced data analysis expressions (DAX) optimization and secure enterprise deployment. To better evaluate the design mechanics involved in this process, review our guide on how to design Power BI dashboards for production performance and cost analysis. This logical flow ensures that participants build robust data backends before designing front-end user interfaces.
The Institute For Oil & Gas Training designs its courses to match corporate skill matrices used by major energy operators. The curriculum combines core data engineering principles with industry business rules. This approach ensures technical professionals master both data transformation mechanics and operational reporting logic. As a result, technical staff design interfaces that instantly highlight operational variances for engineering and finance leadership.
What Are the Core Modules and Learning Outcomes?
Participants master five core modules covering schema design, DAX calculation modeling, operational visual hierarchy, row level security, and cloud service deployment. Learning outcomes focus on automated processing, variance analysis, and secure data access.
Module 1: Data Architecture and ETL Processing
Participants learn to connect Power BI directly to field databases, ERP systems, and cloud data lakes. This module covers data extraction, transformation, and loading (ETL) techniques using Power Query to clean messy field logs and standardize production units.
Building star schema data models optimized for multi-well performance tracking.
Standardizing field measures across varying pressure, volume, and temperature (PVT) conditions.
Merging financial general ledger feeds with daily operational volume tracking tables.
Automating recurring field data intake pipelines to eliminate manual copy-paste errors.
Module 2: Advanced DAX for Production and Financial Modeling
This module focuses on writing fast, efficient DAX expressions tailored to field calculations and financial tracking. Participants learn how to calculate rolling production averages, decline curves, and cost metrics dynamically across complex time intelligence calendars.
Engineering dynamic measures for cost per barrel dashboard interfaces across varying lift methods.
Modeling budget versus actual visuals with dynamic variance thresholds and allocation logic.
Creating time intelligence formulas to evaluate month-to-date, quarter-to-date, and year-to-date production cumulative totals.
Optimizing DAX measures using evaluation context, filter contexts, and performance analyzer tools.
Module 3: Visual Interface Design and KPI Hierarchies
Participants study visualization standards that reduce cognitive load for field supervisors and executive leadership. The curriculum covers layout grids, functional color choices, and navigation paths tailored to operational monitoring workflows.
Applying core dashboard design principles to organize complex operational datasets cleanly.
Structuring KPI visualisation components to highlight downtime, deferments, and budget overruns instantly.
Designing drill-through navigation paths from high-level portfolio overviews down to individual wellhead metrics.
Building clear, action-oriented interfaces that help field managers identify operational issues quickly.
Module 4: Enterprise Governance and Row Level Security
This module focuses on protecting corporate data assets while maintaining secure access for internal and external stakeholders. Participants build security roles that restrict data access based on organizational hierarchy, geographic asset boundaries, or commercial partnerships.
Configuring static and dynamic row level security (RLS) rules using DAX filter expressions.
Implementing secure partner facing reporting dashboards for joint venture operations and non-operating partners.
Establishing workspace permissions, app publication parameters, and service distribution groups.
Auditing report usage, user activity logs, and data exports to maintain enterprise compliance.
Module 5: Automated Refresh Pipelines and Service Management
The final module covers publishing, managing, and maintaining Power BI reports in the enterprise cloud environment. Participants learn to configure gateway infrastructure, schedule automated dataset updates, and manage app environments for operational users.
Configuring scheduled data refresh cadences aligned with daily production logging schedules.
Installing and configuring enterprise gateway configuration models for secure on-premises data connections.
Managing workspace and app deployment environments to separate development, testing, and production states.
Setting up automated email alerts triggered by production drops or budget thresholds.
How Is the Course Delivered and Assessed?
Training is delivered through interactive workshops, virtual live sessions, hybrid tracks, or tailored onsite enterprise cohorts. Learning is validated through practical exercises, dataset transformations, and a capstone dashboard design project.
The Institute For Oil & Gas Training offers versatile training delivery formats designed to fit around operational schedules:
Delivery Format | Structure and Duration | Target Audience | Primary Focus |
Instructor-Led Onsite | Intensive 3-5 Day Workshop | Enterprise Teams & Field Operations | Hands-on lab work using corporate data sources |
Virtual Live Classroom | 4-6 Weeks (2 sessions/week) | Distributed Technical Teams | Interactive lectures, guided practice, and live Q&A |
Hybrid Corporate Program | Self-Paced Modules + Weekly Labs | HR-Led Workforce Initiatives | Scalable skill building combined with mentor reviews |
Course instruction combines lectures with practical technical labs. Participants work with realistic upstream and midstream operational datasets to practice real-world data modeling and visual layout design. Instructors guide participants through complex transformation workflows, showing them how to fix broken schemas and optimize slow DAX measures.
Assessment methods focus on practical application rather than multiple-choice testing. Participants complete weekly lab exercises, schema design challenges, and a comprehensive capstone project. In this capstone, participants design a fully functional production and cost analysis dashboard from scratch using raw field data.
Instructors review project submissions against formal technical rubrics. Evaluators review data model efficiency, measure accuracy, visual clarity, row-level security implementation, and publish settings. Participants receive detailed feedback on their design choices, query performance, and user experience layouts.
What Measurable Results Can Participants and HR Teams Expect?
Graduates build automated, production-ready dashboards that eliminate manual spreadsheet processing and accelerate variance identification. Organizations secure standardized reporting, improved data security, and reduced reporting cycle times.
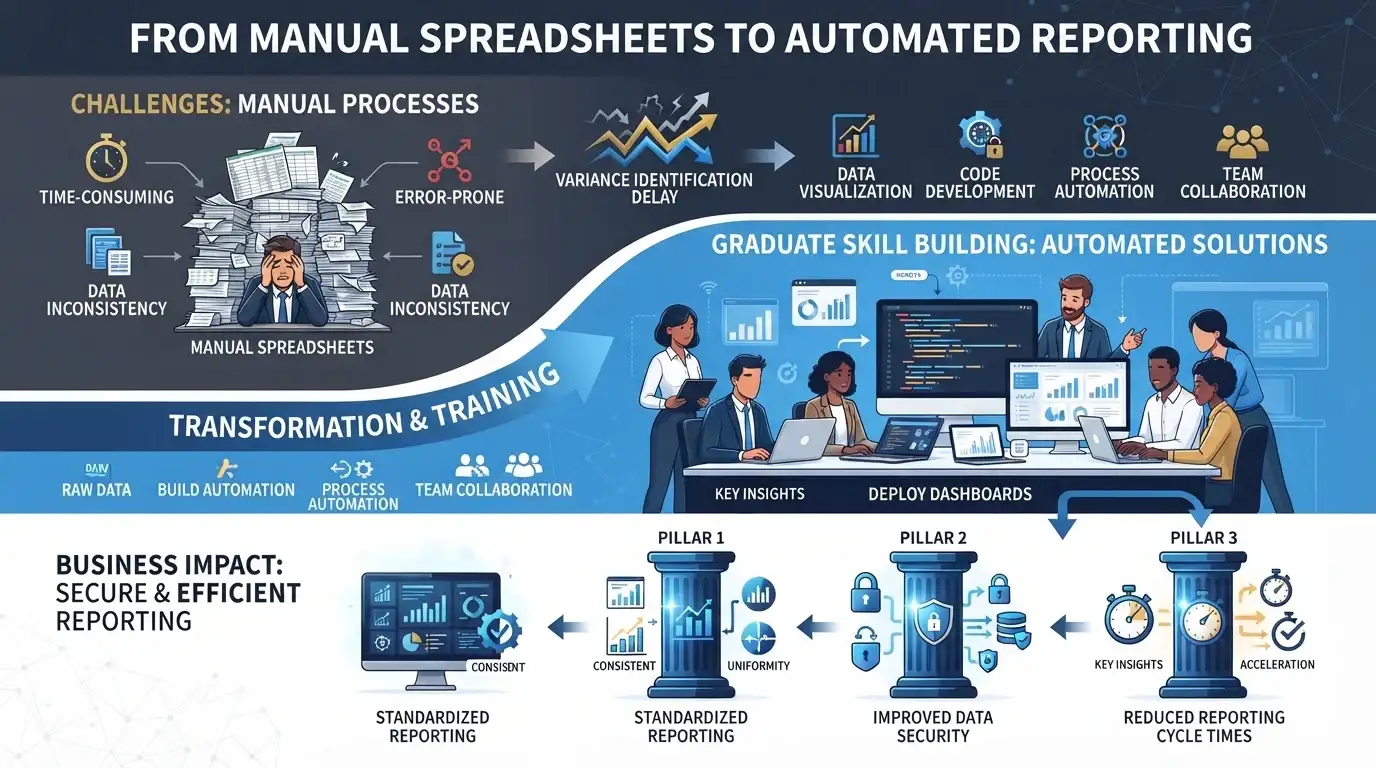
The Institute For Oil & Gas Training focuses on delivering tangible operational value and quantifiable skill gains. Technical professionals complete the course with the skills required to convert complex operational datasets into clear, actionable reporting interfaces.
Reporting Efficiency: Technical teams cut weekly manual reporting effort by 65% to 80% through automated ETL pipelines and scheduled data updates.
Cost Variance Transparency: Financial teams spot operating expense deviations faster by linking budget and actual metrics directly to volume trends.
Standardized Metric Calculations: Engineering and financial teams align on single sources of truth for cost-per-barrel and downtime metrics.
Faster Executive Decision-Making: Leadership receives interactive, drillable reporting dashboards accessible on both desktop and mobile devices.
Secure Joint Venture Reporting: Asset leads share controlled operational performance views with external partners using robust row-level security settings.
For HR leaders and learning directors, this course offers a clear, high-return pathway for upskilling engineering and financial talent. Standardizing dashboard design across teams helps organizations build a data-driven culture, reduce key-person dependency, and improve cross-departmental alignment.
How Does Corporate Enrollment Work for Technical Teams?
Enrollment involves a prerequisite review, candidate skill matching, and customizable corporate seat allocations. Participants complete the program through a structured path from onboarding to formal certification.
The Power BI for Production & Cost Dashboards Design Training Course is designed for petroleum engineers, financial analysts, operations managers, IT data specialists, and business intelligence professionals in the energy sector. Candidates should have a basic understanding of relational databases, spreadsheet formulas, and key oil and gas operational metrics.
Corporate Group Enrollment Process
HR departments and corporate training managers can enroll intact teams or cross-functional groups through a streamlined process:
Needs Assessment: Advisors from the Institute For Oil & Gas Training evaluate the team's current technical skills and data maturity.
Curriculum Alignment: Learning modules can be tailored to incorporate specific corporate data sources, naming conventions, or operational workflows.
Delivery Scheduling: Training sessions are scheduled around operational deadlines, shift rotations, or field maintenance windows.
Cohort Management: HR leads receive regular attendance reports, lab completion updates, and project performance tracking metrics.
Individual Enrollment and Prerequisites
Individual professionals seeking to upgrade their technical reporting skills can join scheduled public cohorts throughout the year. Applicants complete a brief technical background assessment to ensure they have the foundational skills needed for success.
Upon successful completion of all practical labs and the final capstone project, participants earn a formal certification from the Institute For Oil & Gas Training. This credential confirms practical mastery in Power BI modeling, operational metric visualization, and enterprise analytics deployment within the oil and gas sector.
Organisations looking to eliminate manual reporting friction, secure field datasets, and deploy automated operational analytics can review full syllabus specifications and apply for course access to secure team placements in upcoming cohorts.
Frequently Asked Questions
What is Oil & Gas Petroleum Digital Finance & Automation?
Digital finance and automation in the petroleum sector refers to modernising traditional energy accounting, budgeting, and financial reporting workflows using automated digital pipelines. The Institute For Oil & Gas Training provides specialized instruction in Oil & Gas Petroleum Digital Finance & Automation to replace manual spreadsheet consolidation with real-time financial tracking, automated joint-venture accounting, and predictive cost analytics across upstream, midstream, and downstream operational assets.
How does financial automation improve operational performance in the petroleum industry?
Automating petroleum finance workflows eliminates data latency, manual reconciliation errors, and operational reporting silos across enterprise accounting teams. Organizations utilising the Oil & Gas Petroleum Digital Finance & Automation curriculum at the Institute For Oil & Gas Training streamline lease operating expenses (LOE), cost-per-barrel tracking, and capital expenditure variance analysis, enabling leadership to make faster, evidence-based asset management decisions.
Who should enroll in an Oil & Gas Petroleum Digital Finance & Automation course?
This training is engineered for petroleum financial analysts, corporate accountants, joint venture leads, joint-interest billing specialists, and energy sector asset managers. The Institute For Oil & Gas Training structures the Oil & Gas Petroleum Digital Finance & Automation program to benefit both technical finance professionals upgrading their data engineering capabilities and corporate HR teams driving workforce digital transformation initiatives.
What core skills are covered in Oil & Gas Petroleum Digital Finance & Automation training?
Participants gain practical expertise in robotic process automation (RPA) for financial operations, Power BI cost dashboards, Enterprise Resource Planning (ERP) integrations, and enterprise governance. Modules offered by the Institute For Oil & Gas Training within the Oil & Gas Petroleum Digital Finance & Automation track emphasize real-time budget versus actual metrics, dynamic forecasting, and automated data pipeline configuration for complex energy portfolios.
How long does it take to implement Oil & Gas Petroleum Digital Finance & Automation in energy companies?
Initial digital finance competencies can be developed through short-term intensive workshops or extended corporate cohort programs running over several weeks. Following completion of the Oil & Gas Petroleum Digital Finance & Automation program at the Institute For Oil & Gas Training, enterprise finance teams are equipped to deploy automated reporting, dynamic variance dashboards, and secure financial workflows immediately within their live operational environments.
Related training courses
ERP Systems for Oil & Gas Implementation Training Course
- Specialisation
- Oil & Gas Petroleum Digital Finance & Automation
- Duration
- 5 days · 15 CPD hours
Automation of JV & PSC Reporting: Process Candidates Training Course
- Specialisation
- Oil & Gas Petroleum Digital Finance & Automation
- Duration
- 5 days · 15 CPD hours
Automation of JV & PSC Reporting: Data Integration Training Course
- Specialisation
- Oil & Gas Petroleum Digital Finance & Automation
- Duration
- 5 days · 15 CPD hours
More articles
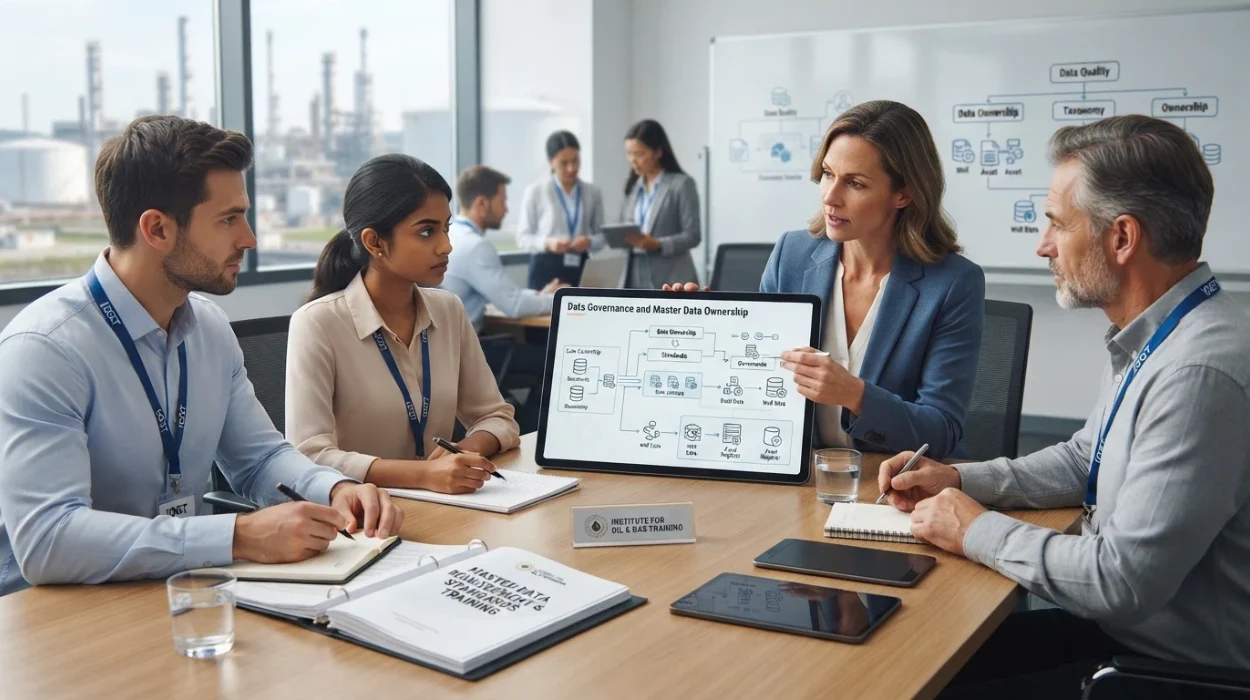
Data Governance and Master Data Ownership and Standards Training by Institute For Oil & Gas Training
Evaluate the Data Governance & Master Data Ownership & Standards Training Course syllabus, delivery, outcomes, and enrollment requirements.
Read article →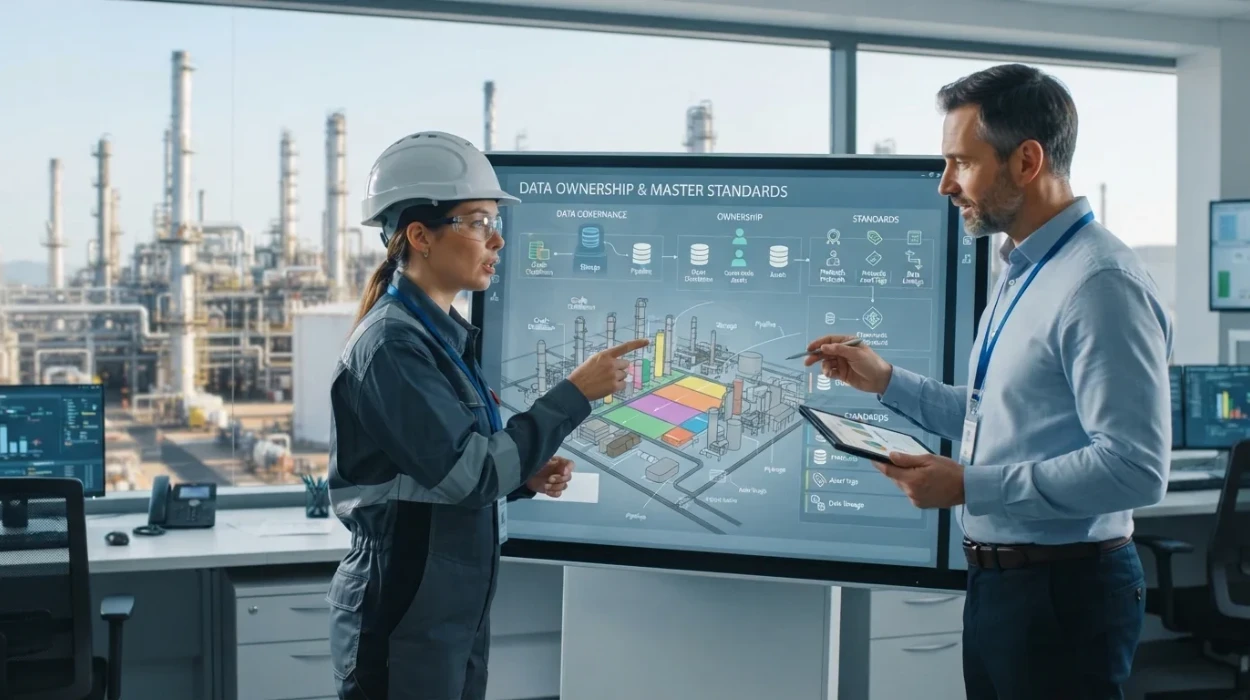
How to Define Data Ownership and Master Data Standards for Petroleum Operations
Learn how petroleum operations define data ownership, establish master data management standards, and improve data governance frameworks.
Read article →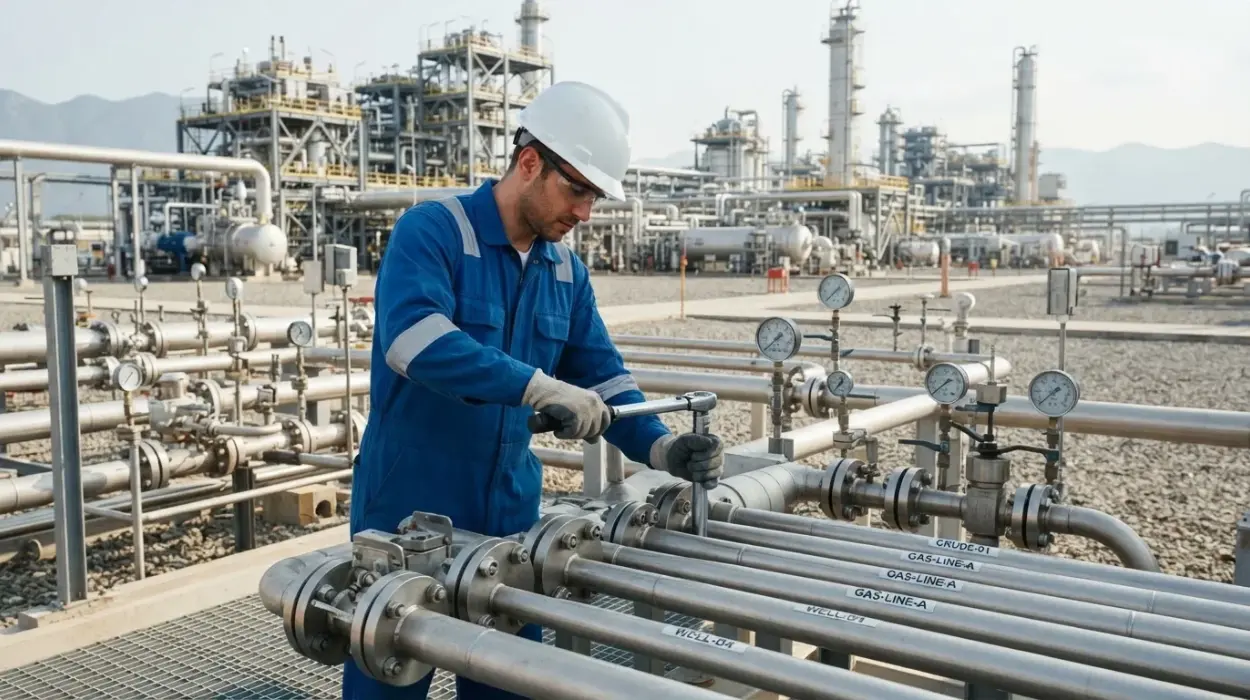
Why Data Governance and Master Data Standards Matter in Oil and Gas
Learn why data governance and master data standards transform petroleum operations, resolve enterprise risk, and drive ROI across global energy assets.
Read article →