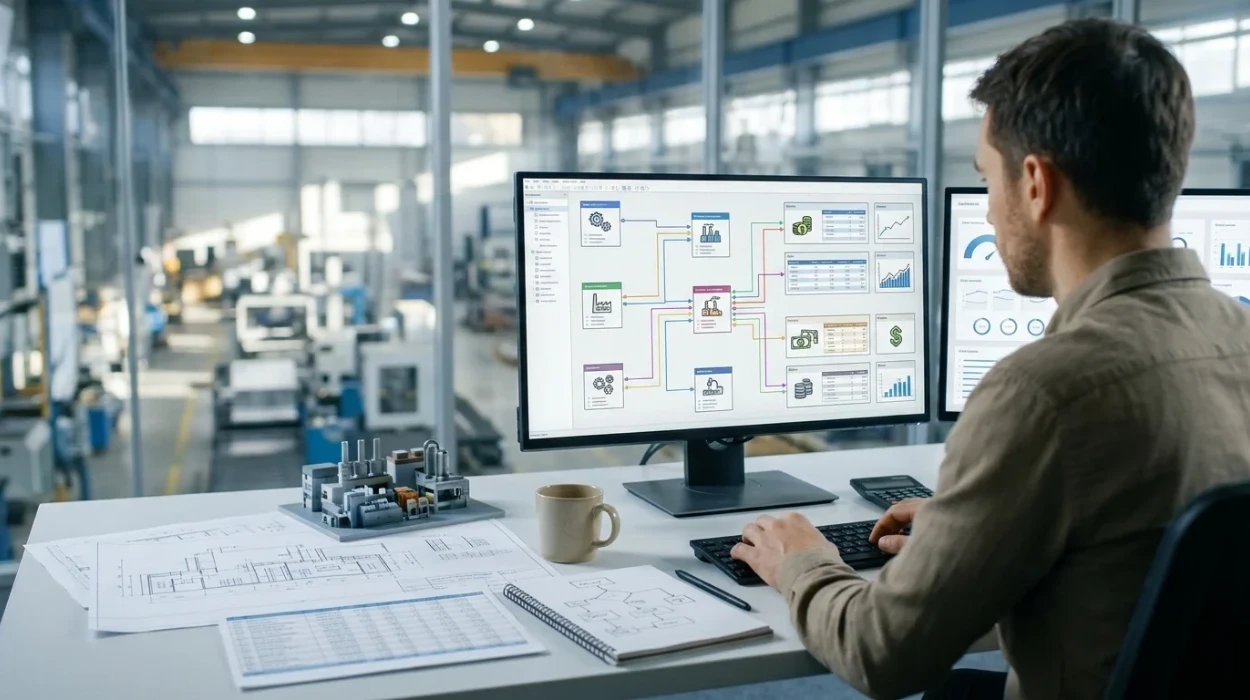
Data modelling converts fragmented operational metrics into structured reporting architectures that drive accurate variance analysis and executive decision-making. In upstream and downstream energy operations, effective data models standardise disparate field units, resolve complex grain misalignments, and accelerate analytical query speeds across enterprise business intelligence systems.
Understanding Why Production and Cost Dashboards Matter in Oil and Gas Decision Making establishes the foundation for evaluating technical architecture choices. Data engineers and business intelligence leaders must structure data to reflect operational realities while preserving query responsiveness. A robust semantic model bridges the gap between raw supervisory control and data acquisition feeds, joint venture accounting records, and executive key performance indicator tracking.
Why is Data Transformation in Power Query Critical for Energy Sector Reporting?
Data transformation in Power Query establishes schema consistency, removes operational noise, and standardises measurement units before loading data into the analytical engine. This stage prevents calculation errors across mixed volume units, currency conversions, and variable field-level operational logging frequencies.
Upstream oil and gas operations generate high-velocity telemetry alongside manual daily drilling reports. Raw data tables frequently contain duplicate timestamp records, non-standard unit measurements, and unpivoted cost allocations. Processing these inputs within the ETL layer guarantees that downstream DAX computations consume clean, uniform structures.
Power Query transformation scripts isolate operational anomalies before data reaches the storage engine. Field measurements reported in barrels per day, cubic metres, and metric tonnes require immediate unit conversion into standard barrels of oil equivalent. Cost records sourced from enterprise resource planning platforms must be unpivoted from monthly column layouts into tabular transactional rows.
Transforming data at the source query level reduces the overall model file size and speeds up memory refresh intervals. Replacing multi-column text strings with integer surrogate keys streamlines data relationships. Establishing custom conditional columns during ETL eliminates the computational overhead of dynamic IF statements in frontend visuals.
Structured transformation rules enforce strict data data types across date, numeric, and text attributes. Enforcing data hygiene at this initial phase protects financial reporting models against missing keys and structural schema drifts.
How Does Star Schema Design Optimise Power BI Model Performance?
Star schema design optimizes performance by separating numeric measurement facts from descriptive context dimensions. This structural arrangement minimizes data redundancy, simplifies relationship paths, enables rapidVertiPaq engine compression, and ensures precise cross-filtering across complex operational and financial reporting metrics.
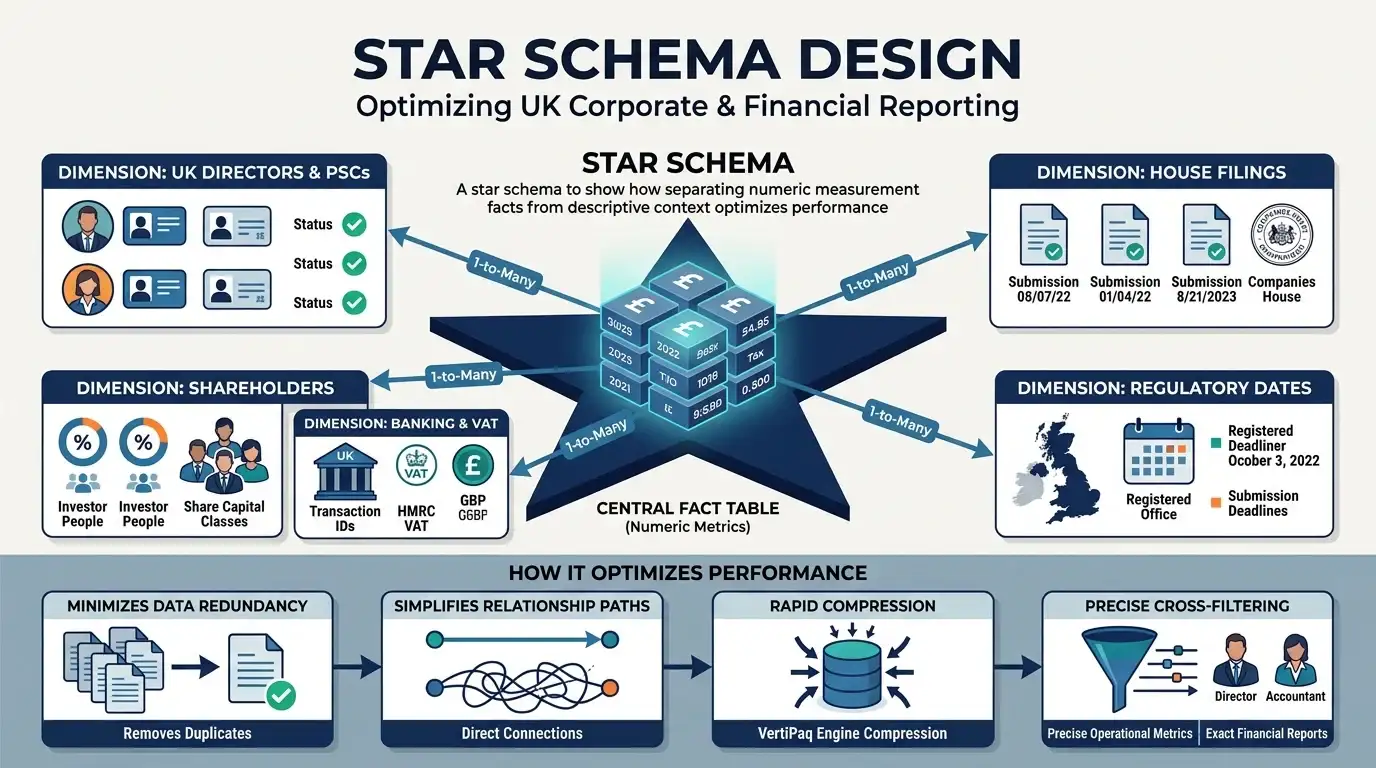
A star schema isolates transactional metrics into central fact tables flanked by descriptive dimension lookup tables. Production volumes and ledger expenses reside in separate fact tables configured at distinct grain levels. Dimensions such as asset geography, well status, lease contracts, and corporate chart of accounts link directly to fact tables through one-to-many relationships.
Fact vs Dimension Table Definitions
Table Type | Primary Content | Granularity Example | Recommended Schema Role |
Fact Table | Numerical measures, metrics, transaction amounts | Daily per well; Monthly per cost centre | Central target for aggregations and DAX measures |
Dimension Table | Attributes, categories, hierarchical descriptors | Unique asset ID; Standard date key | Source for slicers, row headers, and grouping |
Connecting flat, wide single-table exports directly to reports creates redundant text data that degrades memory efficiency. Denormalized flat structures force the VertiPaq engine to compress millions of repeated string values, increasing memory footprints and slowing visual render times. A star schema replaces repeating text strings with compact integer surrogate keys, allowing optimal columnar compression.
Bi-directional relationship filters introduce ambiguity into data paths and degrade dynamic calculation speed. Star schemas use strict single-direction filter propagation, flowing from single-instance dimension tables down to many-instance fact tables. This architecture prevents circular relationship loops and guarantees accurate context propagation across visual elements.
Multi-fact models require explicit handling of grain discrepancies between daily field production records and monthly financial cost ledgers. Creating dedicated, shared dimension tables for calendar dates, operating assets, and joint-venture entities allows smooth side-by-side reporting without direct cross-table coupling.
What Core DAX Measures drive Operational and Financial Variance Analysis?
Core DAX measures evaluate operational performance by dynamically calculating volume ratios, unit costs, dynamic moving averages, and budget-to-actual variances. Explicit DAX formulations enforce strict context control, allowing analysts to compare daily production against monthly financial allocations.
Explicit DAX measures calculate results dynamically based on active filter contexts applied by report users. Base aggregations must evaluate volume and financial totals using scalar functions that handle filter context shifts securely.
Unit economics require ratio calculations that safely manage zero-division scenarios during operational downtime. Calculating lifting cost per barrel of oil equivalent combines financial expenditures with volumetric outputs.
Variance analysis compares real-time production figures against projected operational budgets. Isolating variance calculations into explicit measures supports dynamic conditional formatting across reporting tables.
Avoiding calculated columns within fact tables preserves system RAM and maintains columnar compression efficiency. Calculated columns evaluate during data model refresh and remain statically stored in memory. Explicit DAX measures compute on demand during render cycles, preserving system resources for visual interactions.
Moving averages smooth daily production volatility caused by field maintenance cycles and equipment trips. Rolling calculations evaluate output trends over fixed time windows to isolate baseline declines from operational outages.
How Are Time Intelligence Functions Applied to Production and Cost Data?
Time intelligence functions evaluate operational performance across calendar periods by shifting filter context over continuous date dimensions. These calculations deliver quarter-to-date output tracking, year-over-year cost comparisons, and trailing twelve-month lifting cost trends.
Time intelligence patterns depend on a dedicated, continuous calendar dimension table linked to operational fact tables. The date dimension must contain contiguous calendar entries with no missing days across operating years. Custom fiscal calendars, common in joint venture accounting, require custom offset index columns within the calendar schema.
Year-to-date and prior-year comparisons reveal asset decline curves alongside long-term cost inflation trends. Modifying date context via standard time intelligence calculations simplifies period-over-period tracking.
Handling partial operating periods prevents skewed forecast models when comparing incomplete current months against historical benchmarks. Dynamic date checks filter out future calendar dates, preserving metric accuracy across operational executive dashboards.
Non-additive operational metrics, such as reservoir pressure and daily flow rates, require specialized semi-additive time intelligence measures. Applying LASTNONEMPTY logic captures the final recorded operational state without invalidating total period calculations.
What Design Principles Optimise Visual Selection, Drill Through, and Slicers?
Optimising visual selection, drill-through pathways, and slicers focuses report designs on decision-support workflows while minimizing rendering load. Hierarchical navigation directs users from executive summaries down to asset-level root-cause analyses.
Executive dashboards must highlight high-level operational status through key performance indicator cards and concise line charts. Secondary summary screens present field-level variance details using structured matrix visuals. Detailed transactional ledgers belong on dedicated target pages reached via targeted drill-through actions.
Configuring drill-through functionality maintains low visual counts on primary pages while reserving detailed granular analysis for targeted queries. Passing parameters directly from high-level visuals to target pages preserves exact filter context without cluttering primary viewports.
Selecting lightweight visual elements accelerates canvas loading speeds. Card elements, standard bar charts, and minimal line visualisations process query responses faster than heavy custom visual extensions or unaggregated table matrix visuals displaying thousands of raw rows.
Limiting slicer counts prevents visual query bottlenecks. High-cardinality search slicers trigger excessive engine sweeps during interaction cycles. Replacing individual single-select dropdowns with integrated visual cross-filtering and hierarchical field slicers reduces background DAX queries.
Slicer Type | Cardinality Range | Ideal Use Case | Performance Impact |
Hierarchical Dropdown | Low to Medium | Basin > Field > Well Cluster selection | Low memory consumption; structured query paths |
Date Range Slider | Continuous | Timeline selection across calendar periods | Moderate calculation load; optimized via contiguous keys |
High-Cardinality Search | High (>10,000 values) | Individual asset tag or well serial number lookup | High computational overhead; triggers repeated filter passes |
Configuring precise interaction pathways prevents unnecessary cross-filtering loops across secondary visual elements. Setting visual interaction rules ensures that selecting a specific asset highlights related cost metrics without triggering expensive full-canvas recalculations.
How to Diagnostic and Optimise Report Performance in Production-Grade Models?
Diagnostic performance optimisation identifies operational query bottlenecks using Performance Analyzer and DAX Studio. Resolving bottlenecks involves streamlining relationships, removing unnecessary high-cardinality columns, reducing visual query counts, and rewriting inefficient measures.
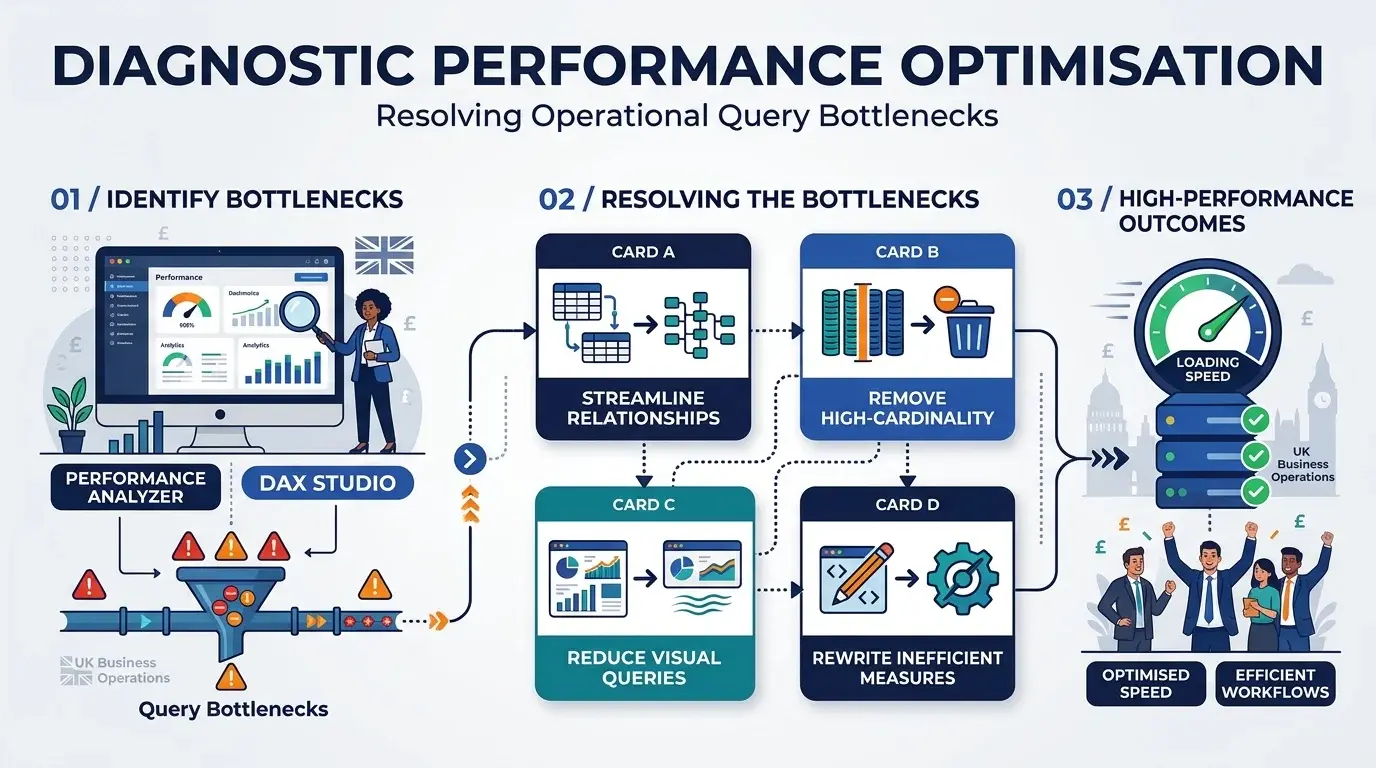
Optimising production models requires measuring visual execution metrics using Performance Analyzer. Diagnostic logs break down rendering durations into DAX query duration, visual display rendering time, and background engine waiting cycles.
When DAX query times exceed acceptable SLAs (typically 1,000 milliseconds per visual interaction), technical leads must analyze execution plans inside DAX Studio. Monitoring VertiPaq engine scans versus Formatter engine requests isolates expensive visual processing patterns.
High-Cardinality Column Removal
High-cardinality text columns, such as raw SCADA system IDs, UUID strings, and detailed text notes, prevent effective data compression in the VertiPaq engine. Removing unused text columns reduces memory footprints significantly, enabling models to reside entirely in high-speed server RAM.
Relationship Cardinality Optimization
Replacing many-to-many relationships with intermediate bridge tables and one-to-many star structures eliminates dynamic ambiguity. Many-to-many relationships force the engine to calculate temporary Cartesian products, driving up memory consumption and query latency.
Measure Calculation Refactoring
Replacing expensive iterative functions like FILTER() with native KEEPFILTERS() modifiers allows the engine to utilize existing storage indexes efficiently. Replacing complex conditional string searches with integer flag checks accelerates execution speeds.
Organizations standardizing operational reporting frameworks often combine internally developed technical architectures with specialized corporate skills development programs. For teams scaling internal analytics capabilities, taking a structured Power BI for Production & Cost Dashboards: Modelling Training Course helps establish enterprise modeling standards across technical teams.
How Should Organisations Evaluate Training Delivery Models for Technical Analytics Roles?
Evaluating analytics training delivery models requires matching learning formats to technical complexity, operational constraints, and business outcomes. Organizations must choose between self-paced digital modules, live virtual workshops, and customized instructor-led corporate programs.
Upgrading analytics capabilities requires selecting a delivery framework that balances cost, scheduling flexibility, and practical skill transfer. Technical topics—such as star schema design, complex DAX patterns, and performance tuning—require immersive, hands-on application using realistic enterprise data schemas.
Analytical Evaluation of Delivery Models
Self-paced video modules offer maximum scheduling flexibility at low upfront costs. However, they frequently suffer from low completion rates and lack the contextual feedback required to master advanced enterprise data modeling. Learners often struggle to apply simplified tutorial datasets to complex, real-world operational environments.
Instructor-led corporate training delivers direct alignment with enterprise data structures and organizational KPIs. Guided workshops allow teams to work directly with sanitized field data, establishing standardized modeling practices while solving active operational reporting bottlenecks.
Evaluation Metric | Self-Paced Digital Learning | Live Virtual Workshops | Custom On-Site Corporate Training |
Technical Depth | Foundational to Intermediate | Intermediate to Advanced | Advanced to Customized Enterprise |
Workflow Relevance | Generic synthetic data | Industry-aligned examples | Custom corporate data schemas |
Time to Competency | 8 to 16 weeks (variable) | 3 to 6 weeks | 1 to 2 weeks (intensive) |
Implementation ROI | Low to Moderate | Moderate to High | High (direct report delivery) |
Selecting the optimal delivery format depends on team size, immediate project timelines, and internal technical maturity. Organizations tackling complex production and financial data integration benefit most from cohort-based or custom corporate training programs.
Engineering and financial teams looking to implement robust, enterprise-grade reporting frameworks can enroll in targeted professional development programs, such as the Power BI for Production and Cost Dashboards Modelling Training by Institute For Oil & Gas Training, to accelerate enterprise adoption and establish standardized data architectures across operational units.
Frequently Asked Questions
How does digital finance automation improve operational efficiency in the oil and gas sector?
Digital finance automation replaces manual reporting processes with integrated systems that connect joint-venture accounting, enterprise resource planning, and field telemetry. By deploying structured financial models, energy companies accelerate monthly closing cycles, reduce data entry errors, and enable real-time variance tracking across capital and operating expenditures. Institute For Oil & Gas Training provides specialized professional development to help teams implement these automated workflows effectively across complex operational portfolios.
What are the primary applications of digital financial transformation in petroleum accounting?
Petroleum digital finance automation applies advanced data modeling, automated reconciliation, and predictive cash flow analytics to oil and gas financial management. These solutions streamline joint interest billing, production volume accounting, regulatory compliance reporting, and asset performance tracking. Professionals trained through the Oil & Gas Petroleum Digital Finance & Automation program learn how to map complex operational data streams directly into interactive executive dashboards for actionable financial insights.
What core skills are required to execute financial automation projects in energy companies?
Building automated financial models requires proficiency in ETL processes using tools like Power Query, star schema data architecture, DAX formulations, and time intelligence logic. Finance and analytics personnel must also understand joint-venture contracts, lifting costs, dynamic currency conversions, and energy sector compliance standards. Comprehensive corporate training from Institute For Oil & Gas Training bridges workforce technical skill gaps, equipping financial analysts and managers to design enterprise-grade reporting models.
Why is star schema design important for oil and gas digital finance dashboards?
Star schema design isolates numerical transactions into central fact tables and descriptive context into dimension tables, which optimizes query performance in business intelligence engines. This structure prevents redundant text storage, establishes clear filter propagation paths, and enables rapid handling of complex metrics like per-barrel lifting costs and field allocations. Master-level training in Oil & Gas Petroleum Digital Finance & Automation focuses heavily on building these efficient relational architectures for large enterprise datasets.
How does workforce upskilling in digital finance drive measurable business ROI?
Upskilling finance and accounting teams in automated data modeling significantly decreases report production hours, minimizes financial discrepancies, and speeds up strategic decision-making cycles. Empowered professionals transition from basic administrative data entry to strategic variance analysis, directly supporting cost optimization and capital allocation. Through practical corporate training programs, Institute For Oil & Gas Training helps organizations achieve high implementation ROI by aligning technical skills with core business outcomes.
Related training courses
ERP Systems for Oil & Gas: Access Controls Training Course
- Specialisation
- Oil & Gas Petroleum Digital Finance & Automation
- Duration
- 5 days · 13 CPD hours
Digital Transformation in Petroleum Finance: AI & RPA Training Course
- Specialisation
- Oil & Gas Petroleum Digital Finance & Automation
- Duration
- 5 days · 15 CPD hours
Automation of JV & PSC Reporting: Process Candidates Training Course
- Specialisation
- Oil & Gas Petroleum Digital Finance & Automation
- Duration
- 5 days · 15 CPD hours
More articles

Data Governance and Master Data Ownership and Standards Training by Institute For Oil & Gas Training
Evaluate the Data Governance & Master Data Ownership & Standards Training Course syllabus, delivery, outcomes, and enrollment requirements.
Read article →
How to Define Data Ownership and Master Data Standards for Petroleum Operations
Learn how petroleum operations define data ownership, establish master data management standards, and improve data governance frameworks.
Read article →
Why Data Governance and Master Data Standards Matter in Oil and Gas
Learn why data governance and master data standards transform petroleum operations, resolve enterprise risk, and drive ROI across global energy assets.
Read article →