
Evaluating break-even oil prices requires measuring the minimum commodity price needed to cover specific cost tiers across asset lifecycles. Upstream financial analysts calculate these thresholds to assess field profitability, rank capital projects, and stress-test corporate investment portfolios against market volatility.
Understanding these underlying financial dynamics builds upon the fundamental principles of Why Break Even Oil Price Analysis Matters for Oil and Gas Field and Portfolio Decisions, which outlines how commodity price volatility impacts strategic upstream asset management. Financial analysts and asset managers must establish clear cost boundaries to differentiate between short-term operating liquidity and long-term capital recovery. By applying consistent economic evaluation frameworks, upstream teams effectively evaluate field viability, balance portfolio risk, and allocate development capital toward high-margin petroleum assets.
How Do Cash, Half-Cycle, and Full-Cycle Break-Even Prices Differ in Upstream Asset Evaluation?
Cash break-even covers daily field operating expenses, half-cycle break-even includes remaining development capital, and full-cycle break-even accounts for total historical exploration, land acquisition, and decommissioning costs. Evaluating all three ensures accurate project ranking and risk management across asset lifecycles.
Financial professionals evaluate upstream petroleum fields by categorising cost structures into distinct economic horizons. The cash break-even price represents the absolute price floor determination required to keep an producing well operational without incurring net operating losses. This metric isolates direct lifting costs, field overhead, tariffs, and royalties. When market prices drop below this threshold, operators shut in production because continuing operations depletes cash reserves.
The half-cycle break-even calculation incorporates ongoing operating costs alongside the remaining capital expenditure required to bring discovered reserves into production. This metric guides development decisions for discovered assets, drilling programs, and facility expansions. Asset managers use half-cycle metrics to evaluate whether incremental capital investments generate positive net present values under current market strip prices.
Full-cycle break-even represents the comprehensive cost per barrel of oil equivalent over the entire life of an asset. This metric factors in unrecoverable sunk costs, including historical seismic surveys, exploratory drilling, lease bonuses, long-term infrastructure, and ultimate abandonment obligations. Corporate planning teams rely on full-cycle evaluations to assess corporate profitability, establish corporate hurdle rates, and report total portfolio performance to institutional investors.
Break-Even Level | Cost Components Included | Primary Strategic Application | Decision Horizon |
Cash Break-Even | Direct operating costs, lifting costs, royalties, production taxes | Operational continuity, shut-in risk management | Short-term (Daily/Monthly) |
Half-Cycle Break-Even | Operating costs plus remaining development Capex and facility expansion | Field development planning, incremental drilling approval | Medium-term (1–5 Years) |
Full-Cycle Break-Even | Exploration, acquisition, development Capex, Opex, and decommissioning | Portfolio capital allocation, corporate benchmarking | Long-term (Full Asset Life) |
What Key Metrics Differentiate Asset Cost Benchmarking Across Petroleum Fields?
Unit operating cost measures immediate lifting expenses, unit technical cost incorporates development capital per barrel, and full-cycle cost adds initial exploration expenditure. Differentiating these metrics allows analysts to determine precise marginal barrel economics and portfolio cost curve positioning.
Accurate financial benchmarking across petroleum basins requires clear standardisation of volume and cost units. Financial analysts evaluate operating efficiency by measuring unit operating cost, which isolates field-level operational expenditures per produced barrel. Lower unit operating costs provide operators with structural resilience during prolonged market downturns, preserving operational cash flow while higher-cost competitors face shut-in pressures.
Evaluating total development efficiency requires calculating the unit technical cost across the asset base. This metric sums total operational expenditures and forward-looking capital expenditures, dividing the total by cumulative recoverable reserves. Upstream teams utilize unit technical cost figures to rank development opportunities across onshore unconventional plays, deepwater assets, and mature conventional fields.
Establishing cost curve positioning allows corporate strategists to plot internal assets against global supply curves. Assets positioned in the first quartile of the global cost curve deliver superior economic rents and maintain high free cash flow margins. Conversely, assets sitting in the fourth quartile face severe impairment risks when global benchmark prices contract, requiring targeted cost-reduction interventions or strategic divestment.
How Do Financial Teams Assess Portfolio Risk Using Marginal Barrel Economics?
Financial teams assess portfolio risk by calculating the marginal barrel economics of incremental production, stress-testing assets against volatile price scenarios, and mapping portfolio cost curves to isolate high-risk barrels, ensuring capital allocation favours assets with sustainable price floors.
Managing an upstream investment portfolio requires continuous evaluation of marginal production economics. Marginal barrel economics examines the precise cost required to produce one additional barrel of oil equivalent from existing or prospective fields. Financial analysts run dynamic sensitivity models to determine how adding or removing specific development tranches alters the weighted-average break-even profile of the entire corporate portfolio.
Portfolio stress-testing applies variable commodity price floors to identify vulnerable assets within the corporate mix. Financial managers establish price floor determination models that test asset performance against low-case price environments, such as 30 to 40 USD per barrel. Fields that generate negative cash flows under these stress scenarios represent concentration risks that threaten corporate balance sheet stability.
Strategic rationalisation relies on identifying high-cost production tranches that dilute overall portfolio returns. Corporate development teams use these insights to structure farm-outs, asset swaps, or asset sales. Eliminating high-break-even barrels lowers the corporate cash break-even price, strengthens liquidity reserves, and improves credit ratings across volatile commodity cycles.
What Methodologies Differentiate Practical Financial Analysis Training for Upstream Teams?
Effective financial analysis training ranges from self-paced online modules and academic seminars to practical, industry-driven corporate workshops. Selecting structured, workplace-aligned programs ensures financial teams apply standardized break-even modeling directly to real-world field evaluations.
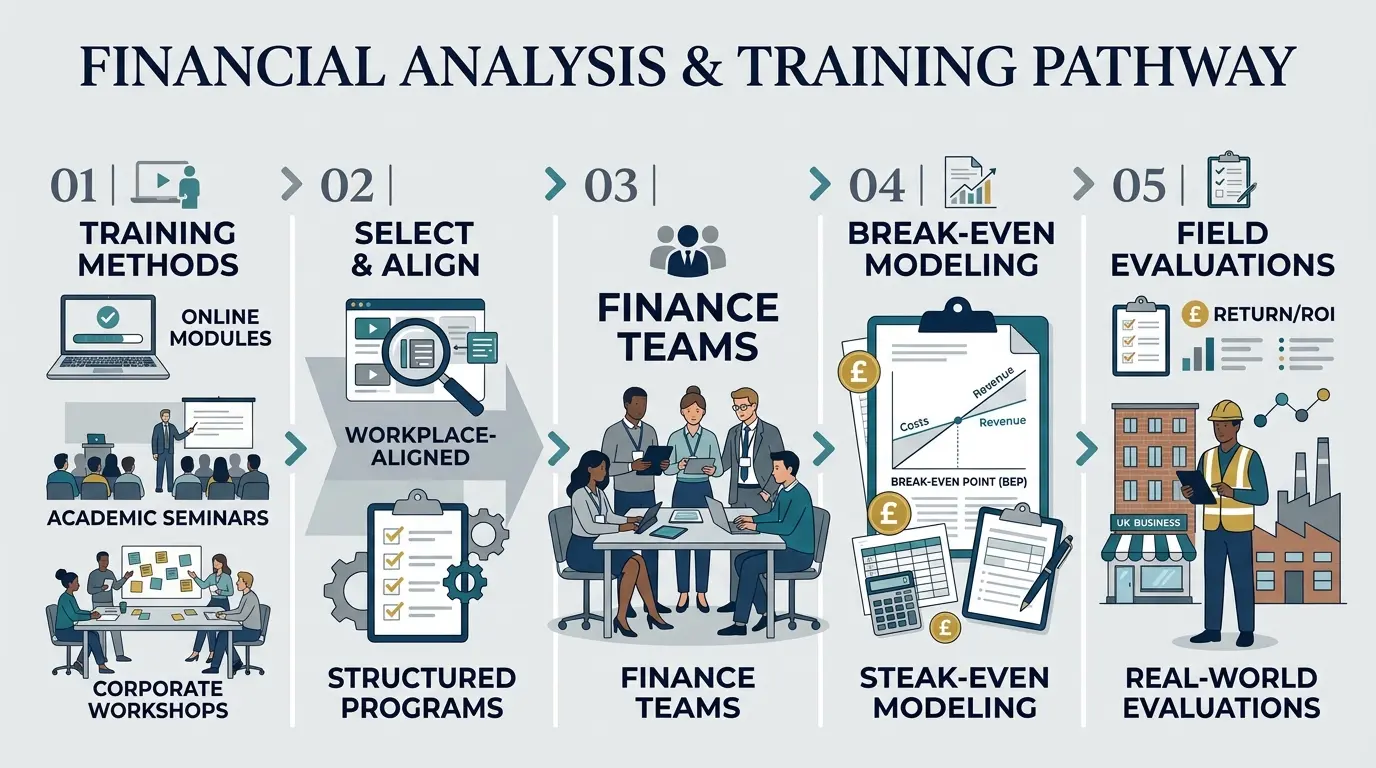
Organizations evaluating options to upskill their finance and commercial teams must examine distinct learning delivery models. Generic academic coursework provides theoretical exposure to capital budgeting concepts but lacks specific upstream petroleum fiscal regime applications. Finance professionals completing broad corporate finance courses often struggle to build complex asset models that incorporate production decline curves, production sharing contracts, and variable royalty structures.
Self-paced digital modules offer flexible scheduling for distributed workforces but frequently lack practical scenario testing. Unsupervised e-learning formats rarely deliver complex petroleum fiscal modeling competencies, as learners miss immediate feedback from expert instructors on complex cash flow mechanics. Consequently, workforce skill gaps persist when analysts attempt to model complex multi-asset portfolios.
Structured, industry-driven corporate programs bridge the gap between financial theory and upstream operational reality. High-impact corporate training models utilize real-world field data, dynamic fiscal regimes, and practical scenario analysis. Organizations seeking to enhance asset evaluation capabilities often enrol commercial teams in specialized programs like the Break-even Oil Price Analysis for Field & Portfolio Training Course, which focuses directly on practical financial modeling, price floor determination, and capital optimization strategies.
To systematically evaluate professional development options for upstream finance teams, HR managers and technical department heads utilize structured decision criteria.
Learning Delivery Model | Practical Relevance | Customization to Asset Base | Skill Acquisition Velocity | Measurement of ROI |
Academic Seminars | Low (Theoretical focus) | Minimal (Generic frameworks) | Slow (Multi-week theory) | Course completion tracking |
Self-Paced E-Learning | Moderate (Standardized concepts) | Low (Static case studies) | Variable (Self-directed) | Knowledge check scores |
Custom Corporate Workshops | High (Industry-driven practice) | High (Company data alignment) | Fast (Intensive application) | Direct work-product output |
How Do HR Teams and Managers Measure ROI on Upstream Financial Training Programs?
HR teams and managers measure training ROI by evaluating post-program modeling accuracy, speed of asset evaluation, standardisation of corporate investment proposals, and the successful execution of capital allocation decisions aligned with corporate cost-curve targets.
Measuring the business impact of corporate training requires tracking clear, quantifiable performance indicators. Human resources leadership and department heads establish pre-training baseline metrics to evaluate workforce skill gaps in economic modeling. Post-training evaluations assess how effectively financial analysts construct multi-scenario cash flow models and apply standardized unit technical cost principles to investment proposals.
Organizations measure tangible returns through increased operational efficiency and standardized capital governance. Trained financial teams reduce the time required to evaluate farm-in opportunities and asset acquisitions by 30 to 40 percent. Standardized economic models eliminate errors in cash break-even price calculations, preventing costly capital misallocations on unviable field developments.
Long-term return on investment manifests in superior corporate portfolio positioning. Commercial teams trained in advanced break-even evaluation techniques deliver high-precision asset rankings to executive committees. To build these organizational capabilities through structured learning frameworks, teams implement formal skill-development initiatives using specialized solutions such as Break Even Oil Price Analysis Training for Oil and Gas Financial Analysis Professionals.
Evaluation Horizon | Key Performance Indicator (KPI) | Measurable Business Outcome |
Immediate (0–30 Days) | Model Construction Speed | 30% reduction in time required to run field cash flow models |
Medium-Term (3–6 Months) | Evaluation Precision | Elimination of calculation discrepancies across asset business cases |
Long-Term (12+ Months) | Capital Allocation Efficiency | Lower average corporate break-even price across the investment portfolio |
How Should Organizations Implement Break-Even Evaluation Frameworks across Assets?
Organizations implement break-even frameworks by standardizing financial modeling protocols across business units, integrating cross-functional engineering and commercial teams, establishing consistent risk metrics, and continuously upskilling corporate finance talent against evolving industry benchmarks.
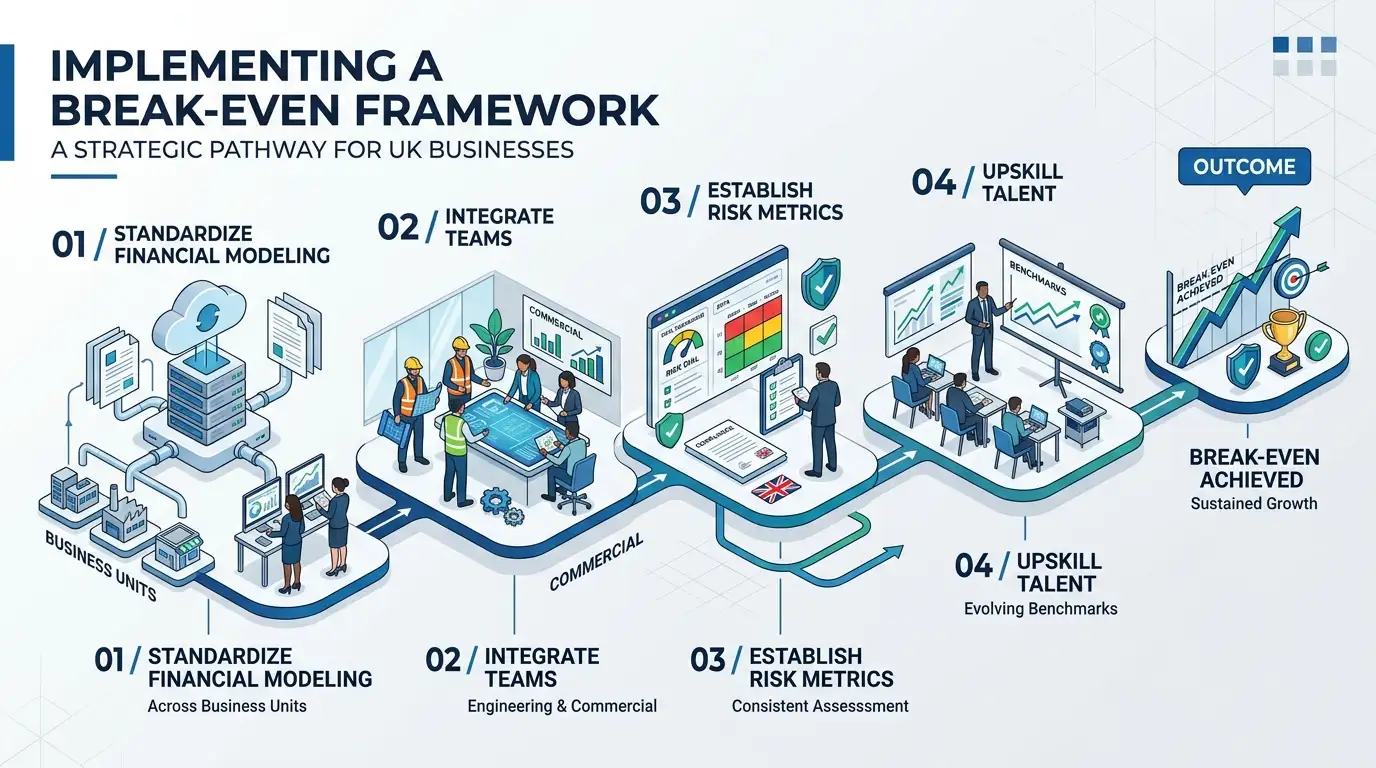
Successful implementation begins with establishing standardized corporate modeling guidelines. Upstream organizations must align technical asset teams, reservoir engineers, and financial analysts around unified cost definitions. Standardizing unit operating cost and unit technical cost parameters ensures that capital proposals from different operating regions undergo identical economic scrutiny.
Cross-functional integration prevents disconnects between technical field assessments and corporate financial planning. Reservoir engineers providing production forecasts must collaborate directly with commercial analysts responsible for pricing discount structures and fiscal regime modeling. This multidisciplinary alignment ensures that half-cycle break-even calculations accurately reflect field-level operational realities.
Continuous workforce development reinforces governance standards across the enterprise. Establishing recurring training cycles ensures that new hires and promoted asset managers maintain high competency levels in economic modeling. By embedding robust break-even evaluation practices into corporate decision-making, upstream organizations maintain disciplined capital allocation, mitigate commodity market risks, and maximize long-term shareholder value.
Frequently Asked Questions
What is covered in Oil and Gas Petroleum Financial Analysis training?
Oil and Gas Petroleum Financial Analysis training covers capital budgeting, field development economics, cash flow modeling, and fiscal regime evaluations such as production sharing contracts. Participants learn to measure cash, half-cycle, and full-cycle break-even prices to evaluate project profitability across upstream asset portfolios. Institute For Oil & Gas Training delivers these practical modules to help commercial teams align financial evaluations with strategic corporate goals.
How do financial teams calculate break-even oil prices for petroleum assets?
Financial teams calculate break-even oil prices by dividing total operational and capital expenditures by cumulative recoverable reserves in barrels of oil equivalent (BOE). This analysis distinguishes between cash lifting costs for short-term operational decisions and full-cycle technical costs for long-term field development planning. Professionals trained by Institute For Oil & Gas Training apply these standardized calculation frameworks to stress-test petroleum investments against market volatility.
Why is unit technical cost important in petroleum economic evaluations?
Unit technical cost combines forward-looking capital expenditures and ongoing operational expenditures per barrel to establish an asset's economic baseline. Measuring this metric allows upstream financial analysts to rank development projects across different geographic basins and determine global cost curve positioning. Institute For Oil & Gas Training integrates unit technical cost benchmarking into its Oil and Gas Petroleum Financial Analysis programs to strengthen corporate capital allocation decisions.
Who should take an Oil and Gas Petroleum Financial Analysis course?
An Oil and Gas Petroleum Financial Analysis course is designed for financial analysts, commercial managers, petroleum engineers, corporate planning teams, and HR leads seeking to upskill technical staff. The curriculum bridges the gap between field engineering data and corporate financial planning, enabling cross-functional teams to build consistent business cases. Institute For Oil & Gas Training tailors this instruction to address workforce skill gaps and support rigorous investment governance.
How does Oil and Gas Petroleum Financial Analysis improve capital allocation for operators?
Oil and Gas Petroleum Financial Analysis improves capital allocation by establishing objective economic thresholds, such as price floor determinations and marginal barrel economics, across all prospective assets. This structured approach prevents capital misallocation toward high-cost production tranches during periods of market uncertainty. Organizations utilizing training from Institute For Oil & Gas Training standardize their evaluation models to maximize portfolio free cash flow and institutional return on investment.
Related training courses
Petroleum Refinery Processes & Operations Training Course
- Specialisation
- Oil & Gas Process Engineering and Operations
- Duration
- 5 days · 15 CPD hours
API RP 1188 Hazardous Liquid Pipeline Facilities Integrity Training Course
- Specialisation
- Oil & Gas Pipeline Integrity and Inspection
- Duration
- 5 days · 15 CPD hours
Internal Audit, Risk Management and Compliance Training Course
- Specialisation
- Oil & Gas Petroleum Compliance, AML & Risks
- Duration
- 5 days · 15 CPD hours
More articles

Production Forecasting and Decline Curve Analysis Training for Oil and Gas Finance Professionals
Master production forecasting and decline curve analysis. Evaluate reservoir performance for oil and gas financial planning.
Read article →
How to Evaluate Production Forecasts and Decline Curves for Reliable Financial Analysis
Learn how to evaluate production forecasts and decline curves to improve financial modeling, risk assessments, and asset valuations in oil and gas.
Read article →
Why Production Forecasting and Decline Curve Analysis Matter in Oil and Gas Financial Planning
Discover why production forecasting and decline curve analysis drive oil and gas financial planning, workforce capability, and corporate capital allocation.
Read article →