
Break even oil price analysis is a systematic financial evaluation framework that determines the minimum commodity price required for an upstream petroleum asset, field development plan, or investment portfolio to cover its total expenditure and achieve operational profitability.
In corporate environments, workforce capability in financial modeling directly dictates how capital allocation decisions occur across hydrocarbon projects. Upstream exploration and production organizations operate within volatile commodity markets where raw Brent or West Texas Intermediate spot prices fluctuate continuously. Organizations rely on technical multidisciplinary teams—comprising petroleum engineers, geologists, commercial analysts, asset managers, and financial officers—to quantify economic risk before committing capital expenditure. Training workforces in this analytical methodology aligns subsurface technical assessment with corporate strategic planning.
When professionals master this analytical framework, they learn to separate revenue projections from essential operational cost structures. Asset teams evaluate project economics across distinct development lifecycle phases, applying standardized metrics across disparate fields. This cross-functional alignment ensures that engineering decisions regarding drilling design, artificial lift implementation, and facility sizing evaluate financial thresholds alongside volumetric recovery. Consequently, corporate decision-makers eliminate subjective capital deployment and establish clear hurdle rates across all regional business units.
How Does Break Even Oil Price Analysis Work in Upstream Organizations?
Upstream organizations execute break even oil price analysis through structured cross-functional workflows that integrate subsurface geological data, capital expenditure planning, operating cost modeling, fiscal regime terms, and discounted cash flow mechanics to establish robust asset performance thresholds.
Corporate implementation follows a rigorous, multi-stage analytical process. First, technical teams gather primary project data, including estimated ultimate recovery volumes, production decline profiles, initial capital expenditures, and ongoing operational overheads. Engineers and commercial analysts establish standardized cost metrics per barrel of oil equivalent across all planned production horizons.
Next, analysts incorporate local fiscal frameworks into the economic model. Production sharing contracts, royalty structures, petroleum profit taxes, and concessionary terms fundamentally alter net revenue distribution between concessionaires and national host governments. Training enables commercial teams to model these complex tax mechanisms accurately under varying price scenarios.
Finally, asset leaders subject the financial model to multi-variable sensitivity testing. Teams test project economics against delayed first-oil dates, capital expenditure overruns, cost inflation, and sudden commodity price collapses. Through structured simulation workflows, decision-makers determine price floor determination points across the portfolio. The process culminates in executive capital ranking, where projects undergo prioritization based on their cost curve positioning and stress-tested resilience.
What Components Are Included in Comprehensive Break Even Price Evaluation?
A complete evaluation encompasses five core economic metrics: unit operating cost, unit technical cost, cash break-even price, full cycle break-even, and half cycle break-even, alongside standardized discount rates and fiscal modeling parameters.
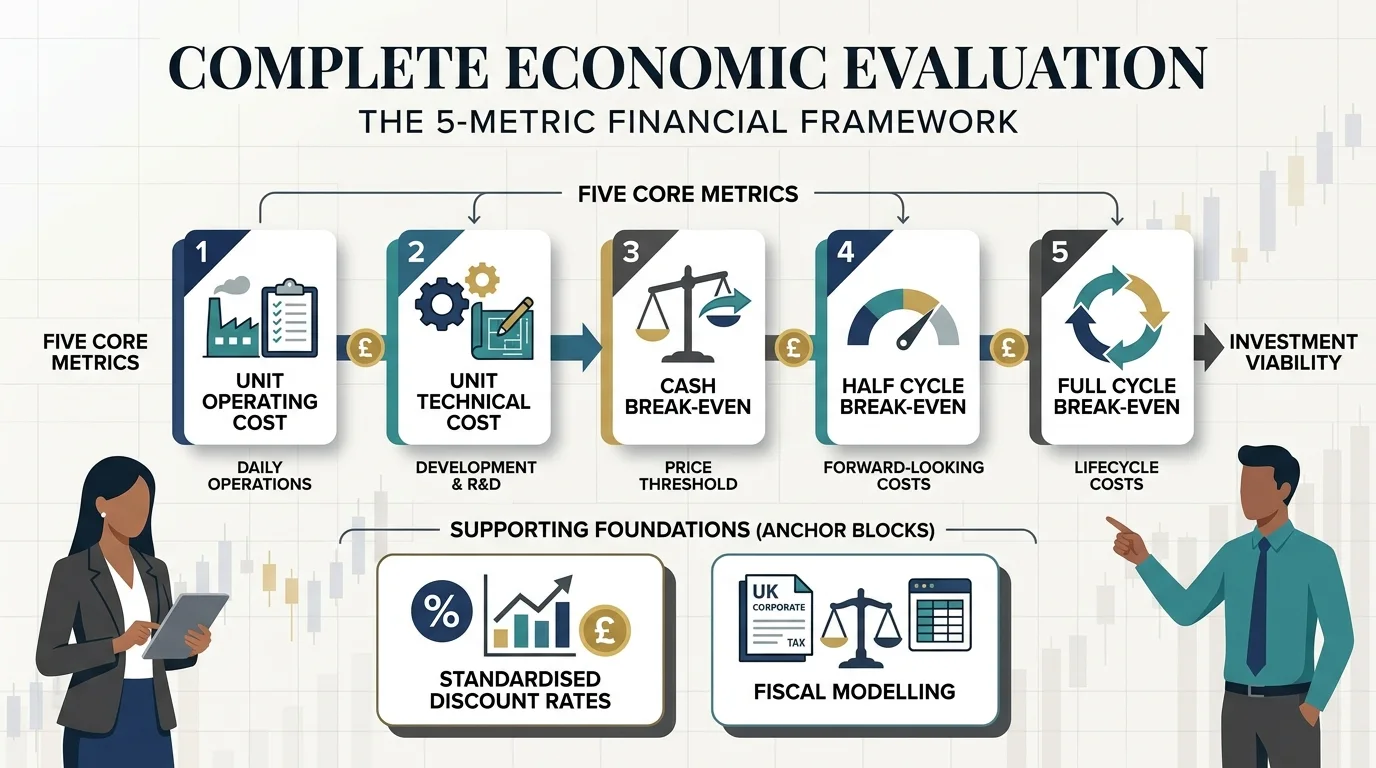
Professional development programs decompose complex upstream asset economics into precise cost and revenue components. Understanding these discrete indicators allows technical personnel to evaluate performance metrics with high accuracy across onshore, offshore, deepwater, and unconventional developments.
Key Economic Cost Indicators
Unit Operating Cost: The ongoing operational expenditure required to produce a single barrel of oil equivalent, covering direct lifting costs, power generation, maintenance, surface facility logistics, and administrative overheads.
Unit Technical Cost: The combined capital expenditure and operational expenditure divided by total recoverable reserves, reflecting the total technical cost per barrel of oil equivalent without accounting for taxation or return on equity.
Half Cycle Break-Even: An economic threshold calculation that excludes historical sunk costs such as initial exploration and appraisal activities, focusing strictly on forward-looking development expenditure, operational expenses, and local tax obligations.
Full Cycle Break-Even: A comprehensive metric incorporating all historical and future financial outlays, including regional exploration surveys, wildcat drilling, appraisal wells, facility construction, field abandonment, and required corporate hurdle rates.
Cash Break-Even Price: The absolute minimum market price required for an operational asset to generate sufficient revenue to cover direct operating expenses and tax liabilities, preventing immediate operational cash drain.
Organizations utilize structured economic models to calculate these indicators systematically. The table below illustrates how these metrics function across project lifecycles:
Metric Category | Sunk Costs Included | Primary Formula Input Focus | Strategic Corporate Application |
Cash Break-Even | Excluded | Operating Expenses + Transportation + Royalties | Shut-in threshold decisions during market downswings |
Half Cycle Break-Even | Excluded | Unsanctioned CAPEX + Direct OPEX + Fiscal Terms | Infill drilling and brownfield expansion screening |
Full Cycle Break-Even | Included | Exploration + Appraisal + Total CAPEX + OPEX | Greenfield exploration licensing and M&A screening |
Unit Technical Cost | Variable | Total Development & Lifting Costs / Total Volume | Benchmarking asset technical efficiency against peers |
How Do Organizations Implement Break Even Price Analysis in Workforce Training?
Organizations implement this analysis through structured corporate learning initiatives combining interactive workshops, case-based learning, financial simulation tools, real-world portfolio datasets, and pre-and-post-program competency assessments.
Corporate learning departments deploy high-impact professional development frameworks designed for rapid skills transfer. Training structured around real-world industry benchmarks enables multidisciplinary asset teams to convert complex financial theory into operational capability quickly.
1. Competency Auditing and Skill Alignment
Learning leads initiate the capability program by assessing current financial literacy levels among technical staff. Engineers, geologists, and commercial planners undergo diagnostic evaluations to identify gaps in cash flow modeling, fiscal terms comprehension, and risk assessment techniques.
2. Interactive Workshop Delivery
Training execution occurs through intensive, practical learning modules spanning 3 to 5 days in workshop or hybrid learning formats. Participants work in cross-functional groups, analyzing historical project datasets from diverse petroleum basins such as the North Sea, Permian Basin, or Gulf of Mexico.
3. Case-Based Learning and Financial Simulations
Learners engage directly with hands-on economic modeling software and spreadsheet architecture. Teams simulate volatile oil price cycles, build cash flow models incorporating PSC and concessionary terms, and calculate marginal barrel economics under varying operational constraints.
4. Post-Training Governance and Performance Integration
Following classroom instruction, participants apply standardized analytical templates directly to active corporate projects. Management teams review field development plans and capital requests using the unified economic frameworks mastered during training.
To understand how technical teams evaluate complex field economics, assess regional tax structures, and build robust capital allocation frameworks across competing assets, professionals reference specialized guides on how to evaluate break even oil prices across petroleum fields and investment portfolios.
What Common Misconceptions Surround Break Even Price Calculations in Upstream Decisions?
Common misconceptions include confusing half cycle with full cycle break-evens, treating breakeven points as static figures, ignoring fiscal regime adjustments, and assuming single-barrel economics scale linearly across complex assets.
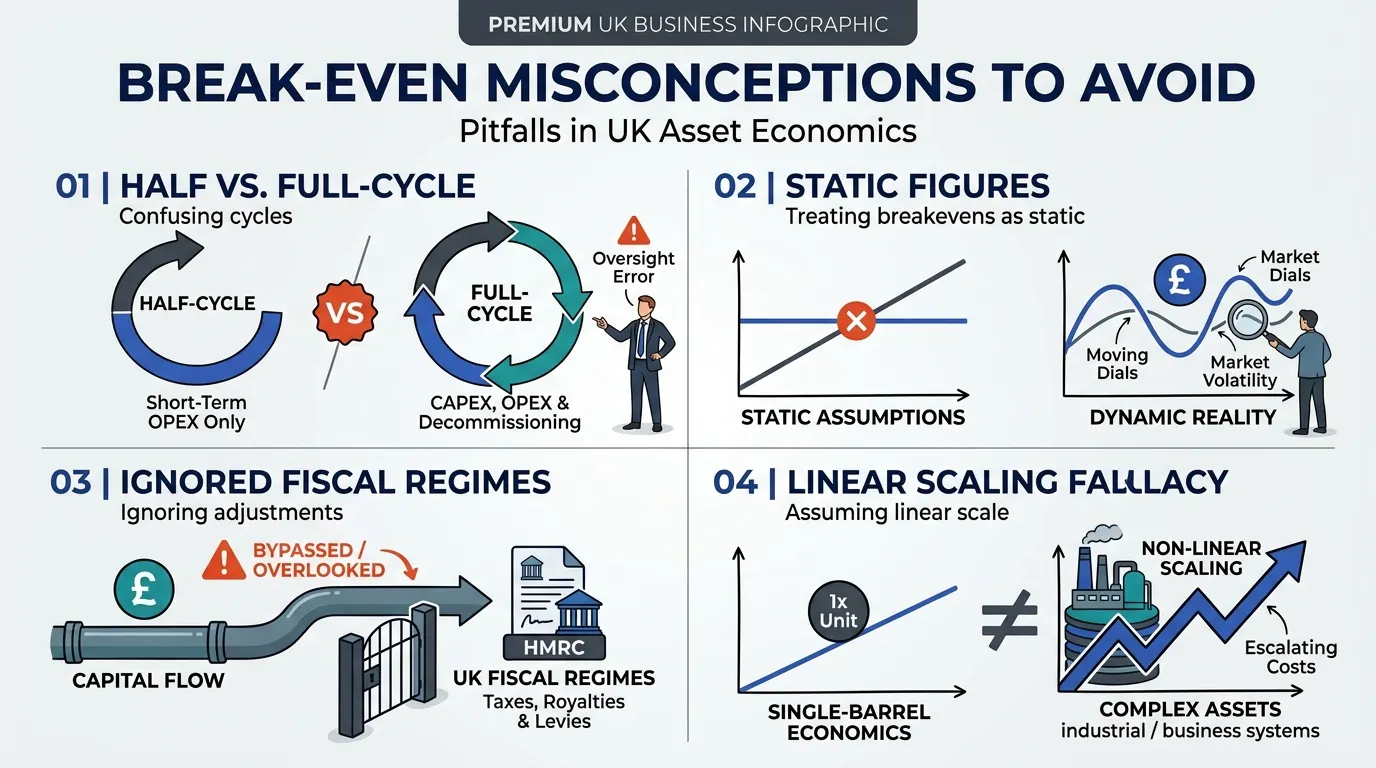
Ineffective workforce training leads to costly analytical errors that compromise corporate decision-making. Strategic decisions deteriorate when multidisciplinary teams rely on incomplete economic assumptions or unstandardized definitions.
Static Price Floor Fallacy
Many technical teams treat an asset breakeven point as a fixed metric established during original project sanctioning. Real-world operational conditions feature shifting supply chain costs, unexpected reservoir decline rates, surface equipment degradation, and evolving water-cut ratios. Effective training teaches professionals to model breakeven points dynamically, recalculating cost thresholds as field operating environments change.
The Half-Cycle Substitution Error
Commercial analysts occasionally report half cycle break-even metrics to executive boards as proof of overall project profitability. While half cycle numbers demonstrate whether a brownfield expansion or infill well justifies immediate incremental capital deployment, they hide original exploration and infrastructure expenditures. Relying exclusively on half cycle metrics distorts corporate capital allocation and risks masking underlying portfolio underperformance.
Neglecting Fiscal Term Non-Linearities
A frequent mistake in preliminary project evaluation is assuming linear scaling of net revenues across varying price decks. Tax brackets, host government profit oil splits, cost recovery caps, and windfall profit levies alter net cash flows non-linearly as oil prices rise or fall. Comprehensive professional development ensures analysts model fiscal sliding scales accurately rather than applying simplified percentage assumptions.
What Measurable Outcomes Does Break Even Analysis Training Produce for Enterprises?
Break even analysis training produces direct corporate outcomes, including a 15% to 25% improvement in capital efficiency, 30% faster project sanctioning reviews, enhanced portfolio resilience during price downturns, and elevated workforce retention.
Investing in structured workforce capabilities yields quantifiable business performance improvements across upstream operations. Standardizing economic evaluation methods elevates overall strategic agility and reduces corporate exposure to commodity price shocks.
Capital Efficiency and Portfolio Optimization
Organizations that train technical teams in standardized financial modeling experience a 15% to 25% improvement in capital deployment efficiency. Asset managers rank capital proposals more effectively, filtering out high-risk marginal projects before significant capital expenditure occurs.
Accelerated Governance and Approval Workflows
Cross-functional alignment between engineering, geology, and finance reduces internal project review cycles by up to 30%. When technical teams present business cases using standard metrics such as unit technical cost and cash break-even price, executive investment committees approve or reject sanction requests with greater speed and confidence.
Upstream Downturn Resilience
Companies with trained financial decision-makers navigate market downturns with lower structural risk. By clearly mapping the price floor determination for every operating asset, management executes precise shut-in strategies, operational cost cuts, and supply chain renegotiations without endangering long-term reservoir integrity or corporate solvency.
Enhanced Workforce Engagement and Talent Pipeline
Providing structured learning paths in commercial strategy strengthens organizational leadership pipelines. Technical professionals who gain financial and strategic capabilities demonstrate higher job satisfaction, driving employee retention rates up by 12% to 18% across exploration, reservoir engineering, and asset management departments.
Organizations seeking to build these specialized commercial capabilities across their technical teams deploy structured professional programs such as the Break-even Oil Price Analysis for Field & Portfolio Training Course to establish consistent, high-impact economic modeling standards across global assets.
Frequently Asked Questions
What is Oil and Gas Petroleum Financial Analysis?
Oil and Gas Petroleum Financial Analysis is the specialized process of evaluating the economic viability, cash flow performance, and capital allocation risks of upstream, midstream, and downstream energy assets. Capital project teams and commercial decision-makers utilize this discipline to assess net present value, internal rate of return, and break-even commodity pricing across complex fiscal regimes. Professional instruction from the Institute For Oil & Gas Training equips industry teams with practical skills to build robust financial models and navigate market volatility.
Why is petroleum financial analysis critical for energy investment decisions?
Petroleum financial analysis provides corporate leaders with data-driven clarity on capital efficiency, project hurdle rates, and cost curve positioning before committing capital expenditure. Integrating technical subsurface data with fiscal terms and sensitivity modeling mitigates investment exposure during oil price downturns. Upstream professionals who complete training with the Institute For Oil & Gas Training master standardized economic metrics to optimize field development plans and asset portfolios.
What components are covered in an Oil and Gas Petroleum Financial Analysis course?
A practical Oil and Gas Petroleum Financial Analysis program covers discounted cash flow mechanics, unit operating cost metrics, taxation frameworks, and production sharing contract economics. Participants learn to execute stress testing, evaluate half-cycle and full-cycle break-even prices, and rank competing portfolio investments. The Institute For Oil & Gas Training delivers this curriculum through real-world case studies and interactive financial modeling simulations.
How does financial analysis training improve cross-functional team performance in energy firms?
Financial analysis training bridges the technical-commercial gap by aligning petroleum engineers, geologists, and asset managers around shared economic key performance indicators. This unified understanding streamlines internal project sanctioning reviews and accelerates governance workflows across regional business units. Organizations utilizing workforce development from the Institute For Oil & Gas Training report improved capital deployment velocity and more resilient field decisions.
Who should undertake Oil and Gas Petroleum Financial Analysis training?
Oil and Gas Petroleum Financial Analysis training is designed for petroleum engineers, commercial analysts, asset managers, corporate planning leads, and finance professionals operating in the energy sector. It is equally valuable for non-financial leaders who require a strong grasp of marginal barrel economics and capital ranking methodologies. The Institute For Oil & Gas Training offers flexible delivery formats, including interactive corporate workshops and hybrid learning modules tailored to team development goals.
Related training courses
Petroleum Refinery Processes & Operations Training Course
- Specialisation
- Oil & Gas Process Engineering and Operations
- Duration
- 5 days · 15 CPD hours
Asset Integrity Management Systems Training Course
- Specialisation
- Oil & Gas Asset Integrity Management
- Duration
- 5 days · 15 CPD hours
Internal Audit, Risk Management and Compliance Training Course
- Specialisation
- Oil & Gas Petroleum Compliance, AML & Risks
- Duration
- 5 days · 15 CPD hours
More articles

Production Forecasting and Decline Curve Analysis Training for Oil and Gas Finance Professionals
Master production forecasting and decline curve analysis. Evaluate reservoir performance for oil and gas financial planning.
Read article →
How to Evaluate Production Forecasts and Decline Curves for Reliable Financial Analysis
Learn how to evaluate production forecasts and decline curves to improve financial modeling, risk assessments, and asset valuations in oil and gas.
Read article →
Why Production Forecasting and Decline Curve Analysis Matter in Oil and Gas Financial Planning
Discover why production forecasting and decline curve analysis drive oil and gas financial planning, workforce capability, and corporate capital allocation.
Read article →