
A Key Performance Indicator (KPI) in petroleum operations is a quantifiable metric that evaluates organizational performance, operational safety, asset integrity, and financial viability across upstream, midstream, and downstream sector activities to ensure strategic enterprise alignment.
Key performance indicators establish measurable benchmarks for production target achievement, workforce efficiency, equipment reliability, and regulatory compliance. In high-risk industrial environments such as offshore drilling platforms, refineries, and distribution pipelines, operational metrics transform complex engineering activities into actionable business data. Executive teams, division heads, and facility managers rely on structured performance measurement systems to maintain operational visibility, reduce unstructured downtime, and eliminate cost inefficiencies across energy infrastructure networks.
Within corporate organizational structures, performance indicators serve as the primary communication bridge between executive strategy and front-line operational execution. Without standardized metrics, operations leaders face systemic challenges including uncoordinated department goals, unmeasured safety risks, capital expenditure overruns, and persistent employee skill gaps across multidisciplinary technical teams. Implementing formalized metrics establishes accountability frameworks across plant operators, maintenance engineers, health and safety supervisors, and supply chain managers.
Petroleum enterprises categorize operational performance through structured measurement frameworks like the balanced scorecard, which balances financial outcomes, customer requirements, internal process execution, and organizational learning. Operational measurement systems classify parameters into leading and lagging indicators. Lagging indicators assess historical outputs, such as annual production volume, total recordable incident rates, and quarterly maintenance expenditures. Leading indicators track proactive activities, such as safety audit completion percentages, preventative maintenance compliance rates, and workforce technical competency assessments.
Properly structured metrics require a comprehensive KPI definition document to guarantee organizational data consistency. This technical record specifies the exact formula, raw data source ownership, update frequency, reporting protocols, and responsible personnel for every individual operational metric. Standardizing these definitions across enterprise business units prevents conflicting operational reporting, streamlines technical decision-making, and accelerates cross-departmental problem resolution in critical production environments.
Why do petroleum companies struggle with operational efficiency and workforce performance?
Petroleum companies struggle with operational efficiency due to fragmented data streams, unaligned departmental objectives, inadequate employee skill sets, informal monitoring processes, and a failure to translate executive corporate strategy into clear technical operational targets.
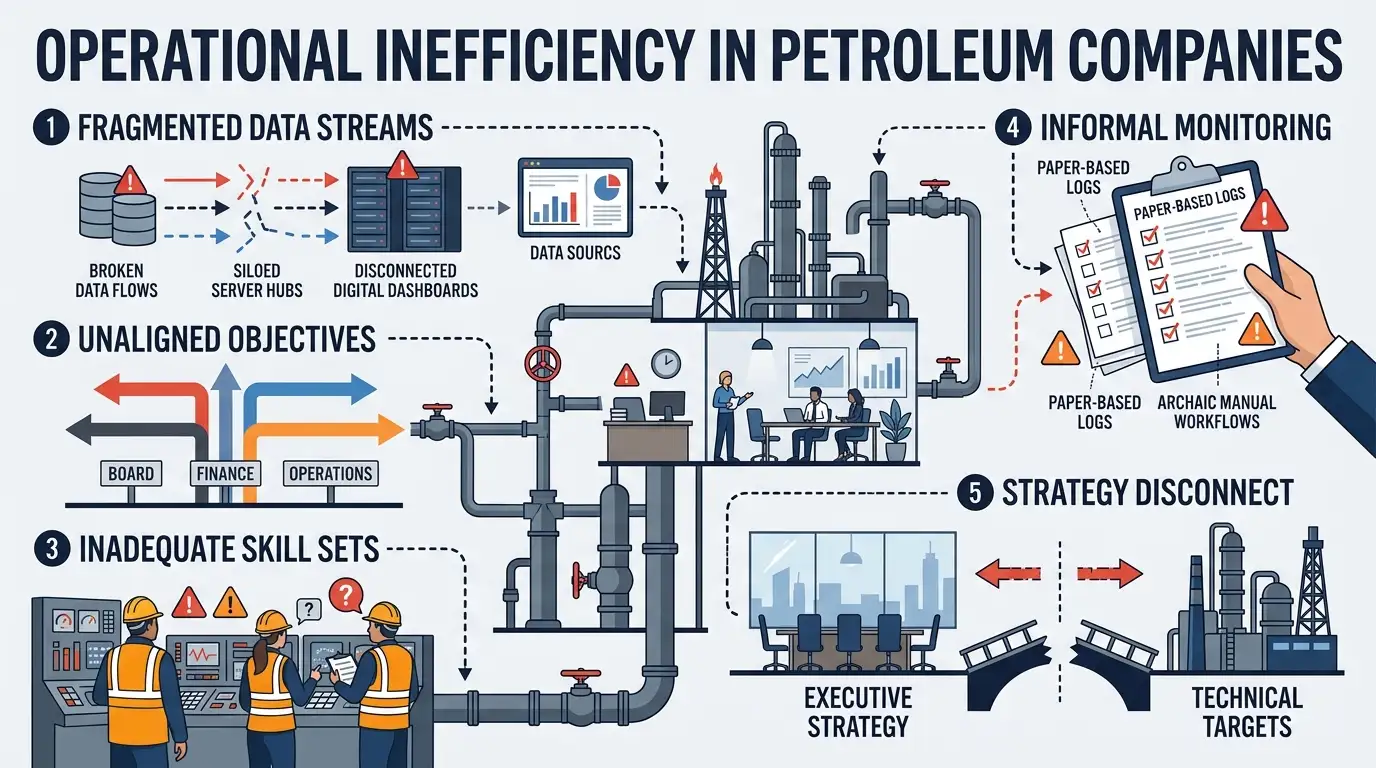
Modern energy organizations operate complex industrial assets across geographically dispersed environments, including remote exploration fields, marine production platforms, transport pipelines, and refining facilities. This geographic and structural dispersion frequently creates isolated organizational silos between corporate management, asset managers, and technical field staff. Departmental teams pursue localized performance objectives that directly contradict enterprise financial and operational goals. For example, production departments maximize daily throughput volumes while asset integrity teams delay essential preventative maintenance schedules to avoid immediate operational shutdowns.
Skill deficiencies among technical personnel severely compound operational inefficiencies. Technical supervisors, control room operators, and facility engineers often lack comprehensive training in modern measurement frameworks, continuous process improvement methodologies, and data interpretation techniques. When team leaders fail to understand the underlying statistical principles of process variation, operational teams interpret normal process fluctuations as severe operational failures or disregard early indicators of critical machinery breakdown.
Unclear operational parameters directly reduce enterprise productivity and increase unplanned operational expenditure. Organizations operating without established target thresholds struggle to maintain consistent process safety standards, experience frequent equipment failure, and suffer from inefficient inventory management practices. Furthermore, a lack of structured operational visibility prevents executive leadership from accurately measuring corporate training effectiveness, evaluating cross-functional team productivity, or executing sustainable workforce transformation initiatives.
Workforce development programs often fall short when corporate learning initiatives remain disconnected from measurable operational metrics. Traditional training approaches deliver theoretical technical knowledge without establishing direct linkages to daily performance tracking, target threshold adherence, or site-level decision-making processes. To overcome persistent skill deficits, enterprise decision-makers implement structured corporate learning initiatives, such as the KPI Design for Petroleum Operations Fundamentals Training Course, which equips technical managers, HR supervisors, and L&D specialists with practical framework design capabilities.
How do organizations implement KPI frameworks through corporate training step by step?
Organizations implement KPI frameworks through a structured five-step learning process consisting of organizational gap analysis, metric framework architecture, measurement methodology standardisation, cross-functional training deployment, and performance review governance.
Step 1: Organizational gap analysis and training needs assessment
The implementation process begins with a rigorous evaluation of existing operational processes, data collection architecture, and workforce competencies. HR managers, L&D professionals, and operations leaders review current reporting practices, identify manual data entry vulnerabilities, and map technical skill deficits across plant staff. This diagnostic phase establishes baseline performance values, calculates current operational variance rates, and defines specific learning objectives required for successful framework rollout.
Step 2: Metric framework architecture and cascading objectives
During the second phase, enterprise leaders establish structural alignment through cascading objectives. Corporate leadership translates top-level business strategies into division-level operational benchmarks, asset-level performance targets, and shift-level personal performance metrics. This alignment hierarchy ensures that every operational role understands how specific daily activities directly influence enterprise financial sustainability, facility throughput, and industrial safety compliance.
Step 3: Measurement methodology and tolerance band definition
Technical specialists establish strict standardization rules for every selected operational metric. Teams develop comprehensive documentation specifying exact mathematical formulas, data collection frequencies, automated system inputs, and measurement methodology guidelines. Enterprise leaders establish threshold and tolerance bands for each parameter, defining acceptable operational variance limits (e.g., green for optimal operating parameters, yellow for acceptable variance requiring monitoring, and red for immediate technical intervention).
Step 4: Cross-functional training delivery and skill build
Organizations deliver practical workforce development programs to managers, engineers, team leaders, and operational supervisors. Training programs use blended delivery formats combining 3-day intensive classroom workshops, interactive online learning modules, and hybrid instructional sessions. Corporate learning methodologies incorporate case-based learning, practical asset simulations, technical role play exercises, and structured pre-and-post-course knowledge assessments. Participants learn to construct functional dashboards, analyze real-time operational data, and execute corrective action plans when metrics breach established tolerance thresholds.
Step 5: KPI governance and review integration
The final step embeds performance metrics into daily operational routines through structured KPI governance and review protocols. Organizations establish formal operational review cadences, including 10-minute daily shift tier-board meetings, weekly facility performance reviews, and monthly executive operations board assessments. Governance rules mandate clear escalation paths, root-cause analysis procedures, and assigned ownership for corrective action execution whenever operational parameters fall below defined standard thresholds.
What key components make up an effective operational measurement system?
An effective operational measurement system includes cascading strategic objectives, standardized metric definitions, clear data ownership, defined threshold tolerance bands, interactive visual display dashboards, and structured governance review cadences.
Operational measurement systems require precise structural components to maintain data integrity, workforce accountability, and long-term organizational value. Incomplete frameworks relying on unstandardized data generate misleading performance indicators, causing incorrect operational decisions across engineering and business units.
Core structural components include:
Cascading objectives matrix: A structural map linking overall enterprise strategy directly down to individual asset, department, and team performance goals.
Standardized KPI definition document: A centralized technical repository recording exact mathematical calculations, reporting frequencies, data formats, and operational context for every metric.
Data source ownership rules: Explicit assignments designating specific systems (such as SCADA, ERP, or computerized maintenance management systems) and individual positions responsible for data collection accuracy.
Threshold and tolerance bands: Quantitative operational boundaries establishing target goals, acceptable upper and lower variation limits, and critical intervention triggers.
Visual management dashboards: Real-time or batch-updated visual control interfaces displaying operational health status through clear color-coded indicators for facility teams.
Governance review schedules: Enforceable organizational meeting structures establishing specific operational review procedures, agenda items, and action-tracking mechanisms.
When evaluating how to structure these technical components within existing business units, organizational decision-makers must review specific program frameworks and training curriculum models. Organizations looking to design and implement robust operational metrics can evaluate the How to Evaluate and Select Effective KPIs for Oil and Gas Operational Performance framework guide to systematically align asset parameters with strategic executive targets.
What corporate benefits do structured operational metrics deliver to teams and businesses?
Structured operational metrics increase overall plant productivity by 15%, lower unplanned equipment maintenance downtime by 25%, reduce workplace safety incidents, and enhance cross-functional team decision-making across complex corporate energy environments.
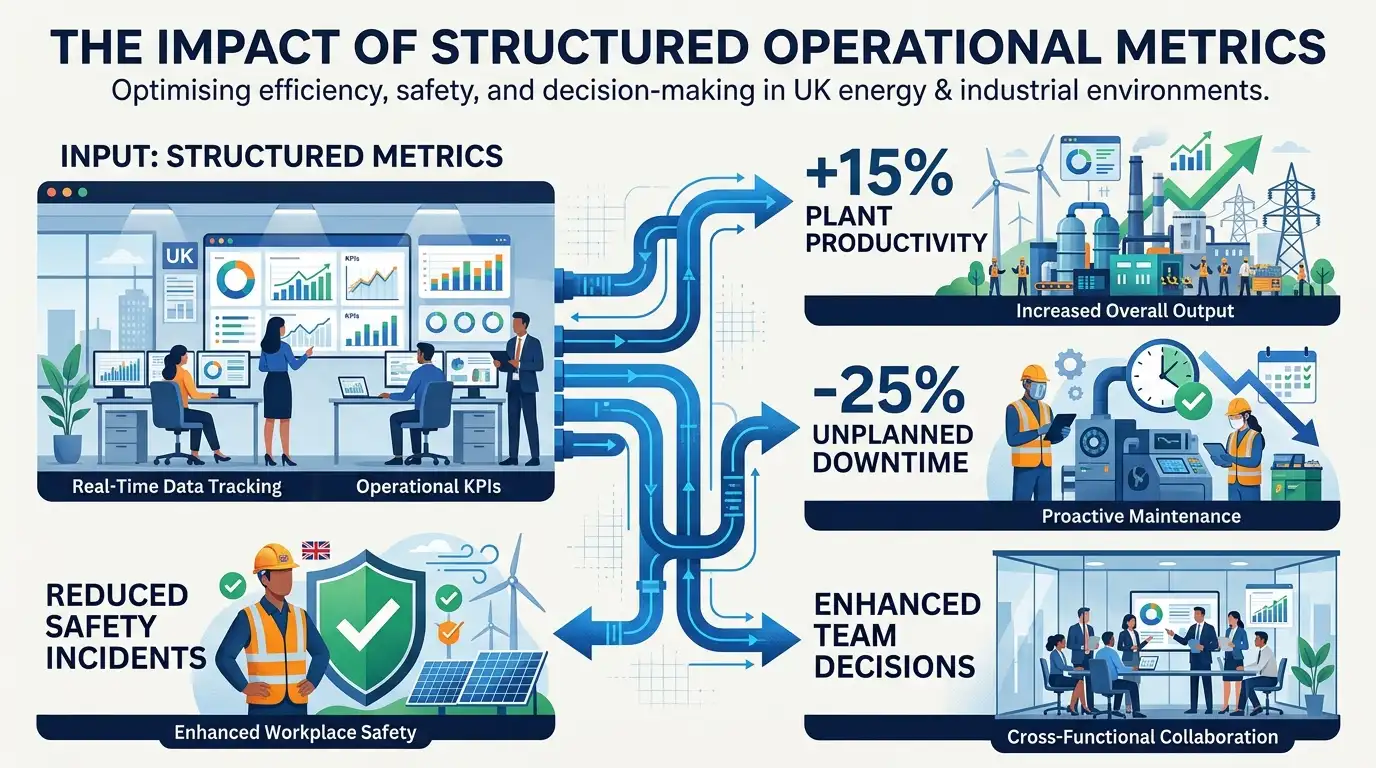
Implementing structured operational performance systems generates immediate and long-term measurable outcomes across multiple enterprise dimensions. Businesses replacing subjective management assessments with objective data architectures improve cost control, risk management, and capital allocation across operational units.
Key organizational benefits include:
Enhanced operational productivity: Establishing clear production targets, process velocity tracking, and waste reduction metrics increases facility throughput efficiency by up to 15%.
Reduced maintenance expenditure: Implementing leading maintenance indicators (such as preventative maintenance compliance and vibration analysis tracking) reduces catastrophic equipment failures and unplanned downtime by 25%.
Improved safety and compliance: Tracking leading safety indicators (such as near-miss reporting, hazard identification rates, and safety training completion percentages) reduces workplace incidents and regulatory non-compliance fines by 20%.
Accelerated managerial decision-making: Standardized visual dashboards eliminate conflicting departmental data interpretations, accelerating cross-functional decision-making speed by 30%.
Increased workforce retention and engagement: Clear performance targets, fair evaluation metrics, and structured development pathways improve employee job satisfaction, raising technical workforce retention rates by 18%.
Optimized workforce training ROI: Enterprise decision-makers track post-training skill application directly through operational output metrics, ensuring quantifiable return on corporate learning investments.
How do different energy sector departments apply performance metrics in daily operations?
Energy sector departments apply performance metrics across upstream exploration, midstream transport, downstream refining, health and safety management, and human resource learning units to control process variation and optimize assets.
Every operational division within a petroleum enterprise utilizes targeted metrics to solve specific technical and managerial challenges. Aligning functional departments under a unified metric methodology ensures cohesive performance optimization across the entire corporate energy value chain.
Primary departmental applications include:
Upstream exploration and production teams
Upstream technical teams utilize performance indicators to optimize drilling performance, reservoir extraction rates, and subsea operations. Key metrics track drilling rate of penetration (ROP), non-productive time (NPT) percentages, well completion efficiency, and daily barrel oil equivalent (BOE) recovery rates. Tracking these parameters allows field engineers to adjust drilling parameters in real time, reducing costly rig downtime.
Midstream pipeline and logistics divisions
Midstream operational units apply metrics to monitor hydrocarbon transportation efficiency, storage terminal capacity, and pipeline integrity. Core indicators measure pipeline throughput utilization percentages, transit loss rates, pump station availability, and pressure monitoring variance. Operational teams use these data streams to prevent pipeline leaks, optimize compressor fuel usage, and balance batch transportation schedules.
Downstream refining and processing facilities
Refining operations utilize complex process metrics to maximize product yields, optimize energy consumption, and manage asset reliability. Standard metrics track refinery yield percentages per crude grade, energy intensity index (EII) ratings, heat exchanger efficiency, and mean time between failures (MTBF) for critical rotating equipment. Continuous monitoring ensures operating units maintain optimal thermodynamic limits and meet precise product quality specifications.
Health, safety, and environmental (HSE) management units
Safety departments utilize balanced indicator sets to maintain strict zero-harm operational cultures and environmental compliance standards. Key parameters measure near-miss reporting frequency, personal protective equipment audit compliance rates, total recordable incident rates (TRIR), and greenhouse gas emissions intensity. Tracking leading safety behaviors alongside lagging incident data allows HSE managers to intervene before operational hazards result in serious industrial accidents.
Learning and development (L&D) and HR departments
Human resource managers and L&D specialists track workforce competency development, technical skill acquisition, and training effectiveness across enterprise teams. Essential HR indicators evaluate employee skill gap closure percentages, technical assessment pass rates, post-training productivity improvement metrics, and operational certification compliance. Linking learning metrics directly to asset performance indicators enables L&D teams to justify training budgets through documented operational ROI.
What common mistakes cause operational measurement frameworks and corporate training to fail?
Operational measurement frameworks fail when organizations select excessive metrics, utilize unstandardized data sources, ignore leading indicators, implement generic training programs, and fail to establish formal KPI governance review structures.
Despite investing substantial capital in performance management systems and corporate learning, energy enterprises frequently fail to achieve expected operational improvements. Identifying and eliminating structural failure points ensures long-term framework sustainability.
Critical organizational failure modes include:
Metric overload and operational paralysis: Attempting to track dozens of uncoordinated parameters confuses plant operators and dilutes focus from critical safety and production metrics. Effective systems limit focus to core strategic parameters per operational role.
Over-reliance on lagging indicators: Managing facilities solely through historical financial and incident reports prevents operational teams from taking proactive corrective action. Sustainable frameworks balance lagging outputs with leading behavioral and preventative indicators.
Unstandardized data sources and manual entry errors: Collecting operational data through unvalidated manual spreadsheets introduces human error and creates conflicting performance reports across management tiers. Automated data collection through integrated plant systems guarantees data consistency.
Generic, non-contextualized training programs: Off-the-shelf management training courses that lack specific petroleum engineering context fail to build practical technical competencies. Workforce development must utilize industry-specific operational scenarios, actual plant case studies, and realistic asset data.
Absence of formal operational governance: Installing display dashboards without establishing mandatory review schedules, escalation protocols, and action-tracking mechanisms results in ignored operational data and persistent process breaches.
Frequently Asked Questions
What does oil and gas petroleum financial analysis involve?
Oil and gas petroleum financial analysis involves evaluating capital expenditure, cash flow projections, production economics, and asset valuations across upstream, midstream, and downstream operations. Through structured corporate programs at the Institute For Oil & Gas Training, finance professionals and technical leaders learn to model fiscal regimes, assess exploration risks, and optimize enterprise portfolio performance.
How does financial analysis improve decision-making in petroleum operations?
Financial analysis provides quantitative visibility into operational cost structures, project profitability, and capital allocation risk across volatile energy markets. The Institute For Oil & Gas Training equips industry decision-makers with advanced petroleum financial analysis techniques to evaluate field development plans, forecast commodity price sensitivities, and maximize return on investment.
Who should take an oil and gas financial analysis training course?
This specialized training targets financial analysts, corporate accountants, asset managers, petroleum engineers, and commercial leads responsible for capital budgeting and project evaluation. The Institute For Oil & Gas Training delivers practical Oil and Gas Petroleum Financial Analysis instruction to bridge the gap between technical field data and strategic financial planning.
Why is economic modeling critical for oil and gas assets?
Economic modeling accounts for complex production decline curves, royalties, production sharing contracts, and decommissioning liabilities unique to energy extraction projects. Mastering Oil and Gas Petroleum Financial Analysis through the Institute For Oil & Gas Training enables professionals to construct robust discounted cash flow models and conduct scenario analysis for high-risk assets.
What are the core components of petroleum corporate financial evaluation?
The key components include reserve valuation, capital expenditure tracking, operating expense management, tax fiscal regime analysis, and economic feasibility testing. The Institute For Oil & Gas Training provides comprehensive instruction in these methodologies to ensure organizations maintain rigorous corporate governance and precise financial reporting standards.
Related training courses
Diesel and Gasoline Quality Testing Training Course
- Specialisation
- Oil & Gas Quality Control and Product Analysis
- Duration
- 5 days · 15 CPD hours
Welding Inspection and Quality Control Training Course
- Specialisation
- Oil & Gas Welding Inspection and Metallurgy
- Duration
- 5 days · 15 CPD hours
Process Safety Risk Assessment Training Course
- Specialisation
- Oil & Gas Process Safety Management
- Duration
- 5 days · 15 CPD hours
More articles

Cost per Barrel KPI Design Training for Petroleum Operations Professionals
Evaluate the KPI Design for Petroleum Operations Cost per Barrel Training Course. Review modules, outcomes, and enrolment details.
Read article →
How to Measure and Evaluate Cost per Barrel to Improve Oil and Gas Operational Efficiency
Learn how to measure and evaluate cost per barrel in petroleum operations to optimize operating costs, uptime, and financial KPI accuracy.
Read article →
Why Cost per Barrel Is a Critical KPI for Petroleum Operations
Learn how Cost per Barrel impacts upstream profitability, operational efficiency, capital allocation, and workforce training in oil and gas.
Read article →